

A new SKU lands on your shelf with almost no sales history behind it. Six months later it is your best seller. A year after that, a competitor's cheaper version starts eating its volume. By month eighteen you are staring at pallets of it in the back room, wondering how it got there.
That arc has a name: the product life cycle in supply chain management. Every category manager and replenishment planner deals with it, whether they call it that or not. The retailers who name it explicitly tend to make fewer expensive guesses.
This guide breaks down what is the product life cycle in supply chain management. It covers why the same SKU needs a different forecasting and stocking approach depending on where it sits on that curve. And it covers how retailers automate the transition between stages, instead of catching it after the numbers already went sideways.
What is the Product Life Cycle in Supply Chain Management?
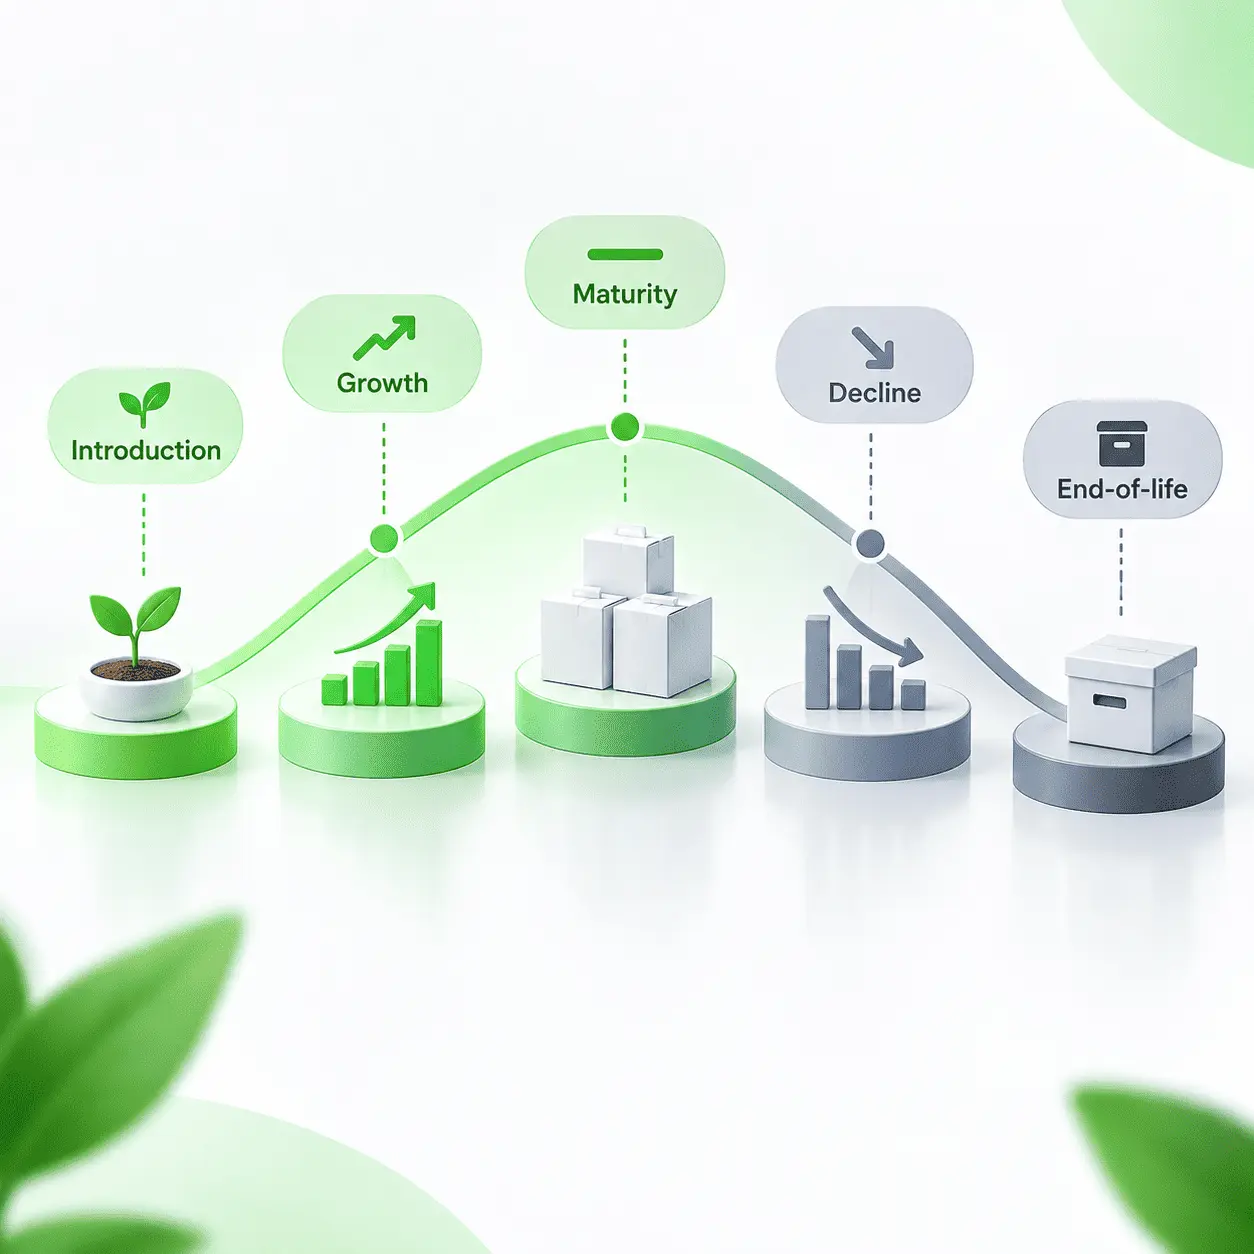
So what is product lifecycle management, in the sense that matters to a retailer rather than an engineer? Product lifecycle management (PLM) describes the stages a product moves through, from the moment it enters your assortment to the moment it leaves it. In a retail and supply chain context, that usually means four to five stages: introduction, growth, maturity, decline, and eventual end-of-life. Demand, margin, and the right inventory strategy look different at each one, even for the exact same item.
Here is where a lot of confusion creeps into search results on this topic. Search "product lifecycle management" and you will get flooded with SAP-style PLM content about CAD files, bills of materials, and engineering change orders. That discipline covers how a product is designed and manufactured. Product lifecycle management in supply chain terms and product life cycle for supply chain planning point at something else entirely: a demand curve with distinct phases. Maybe you searched for PLM in supply chain expecting help forecasting a new snack flavor or a phone case and landed on engineering software instead. This article is about the problem you actually have.
Supply chain product lifecycle thinking treats a life cycle stage as a demand pattern, on par with seasonality or a promotional lift. A product in its introduction stage has no sales history to forecast from. A product in decline has a shrinking, more volatile demand curve. Treating both the same way, with the same safety stock formula and the same reorder logic, wastes money. Most of the waste in a retail assortment traces back to exactly this.
The 5 Stages of the Product Life Cycle in Supply Chain
Every product moves through the same broad arc, even though the speed and shape of the curve differ by category. Here is what each stage looks like from a supply chain seat, not a marketing one.
Stage 1: Introduction
The product is new to your assortment. There is little or no sales history, so classic time-series forecasting has almost nothing to work with. Demand is uncertain in both direction and size: the item could take off in week two or sit flat for a quarter. This is also the highest-risk stage for stockouts. Early momentum is fragile, and a single missed replenishment window can kill a launch before shoppers ever get a second look.
Stage 2: Growth
Sales start climbing as awareness builds and repeat purchases kick in. Demand becomes more predictable, but this is also the stage where undersupplying is most costly. Every unit you are short on a growing item is a unit a competitor's product picks up instead. Buffer levels typically need to increase faster than the forecast alone suggests. A system that only reacts to yesterday's sales will always be a step behind a rising curve.
Stage 3: Maturity
Growth flattens. Sales are steady and reasonably forecastable, competitors have entered the category, and margin pressure usually increases. This is where a retailer's standard reorder point and safety stock rules work best. The demand pattern here is closest to the textbook assumption: stable average demand, with normal variation around it.
Stage 4: Decline
Sales start falling, sometimes gradually, sometimes fast once a replacement product or a trend shift arrives. The risk flips from stockouts to overstocks. Carrying the same buffer you carried during maturity now just freezes capital in units that move slower every week. Planners who wait for a formal end-of-life decision often move too slowly. They are usually the ones writing off inventory a few months later.
Stage 5: End-of-Life and Phase-Out
The product is being wound down, deliberately or because demand has collapsed. An end-of-life product supply chain decision should trigger before the shelf actually goes empty, not after. Remaining stock needs to be redistributed or marked down before it becomes dead stock, and the SKU eventually gets pulled from the assortment matrix entirely. Product phase-out handled well recovers most of the remaining margin. Handled late, it just becomes a write-off line.
How Each Lifecycle Stage Changes Your Supply Chain Strategy
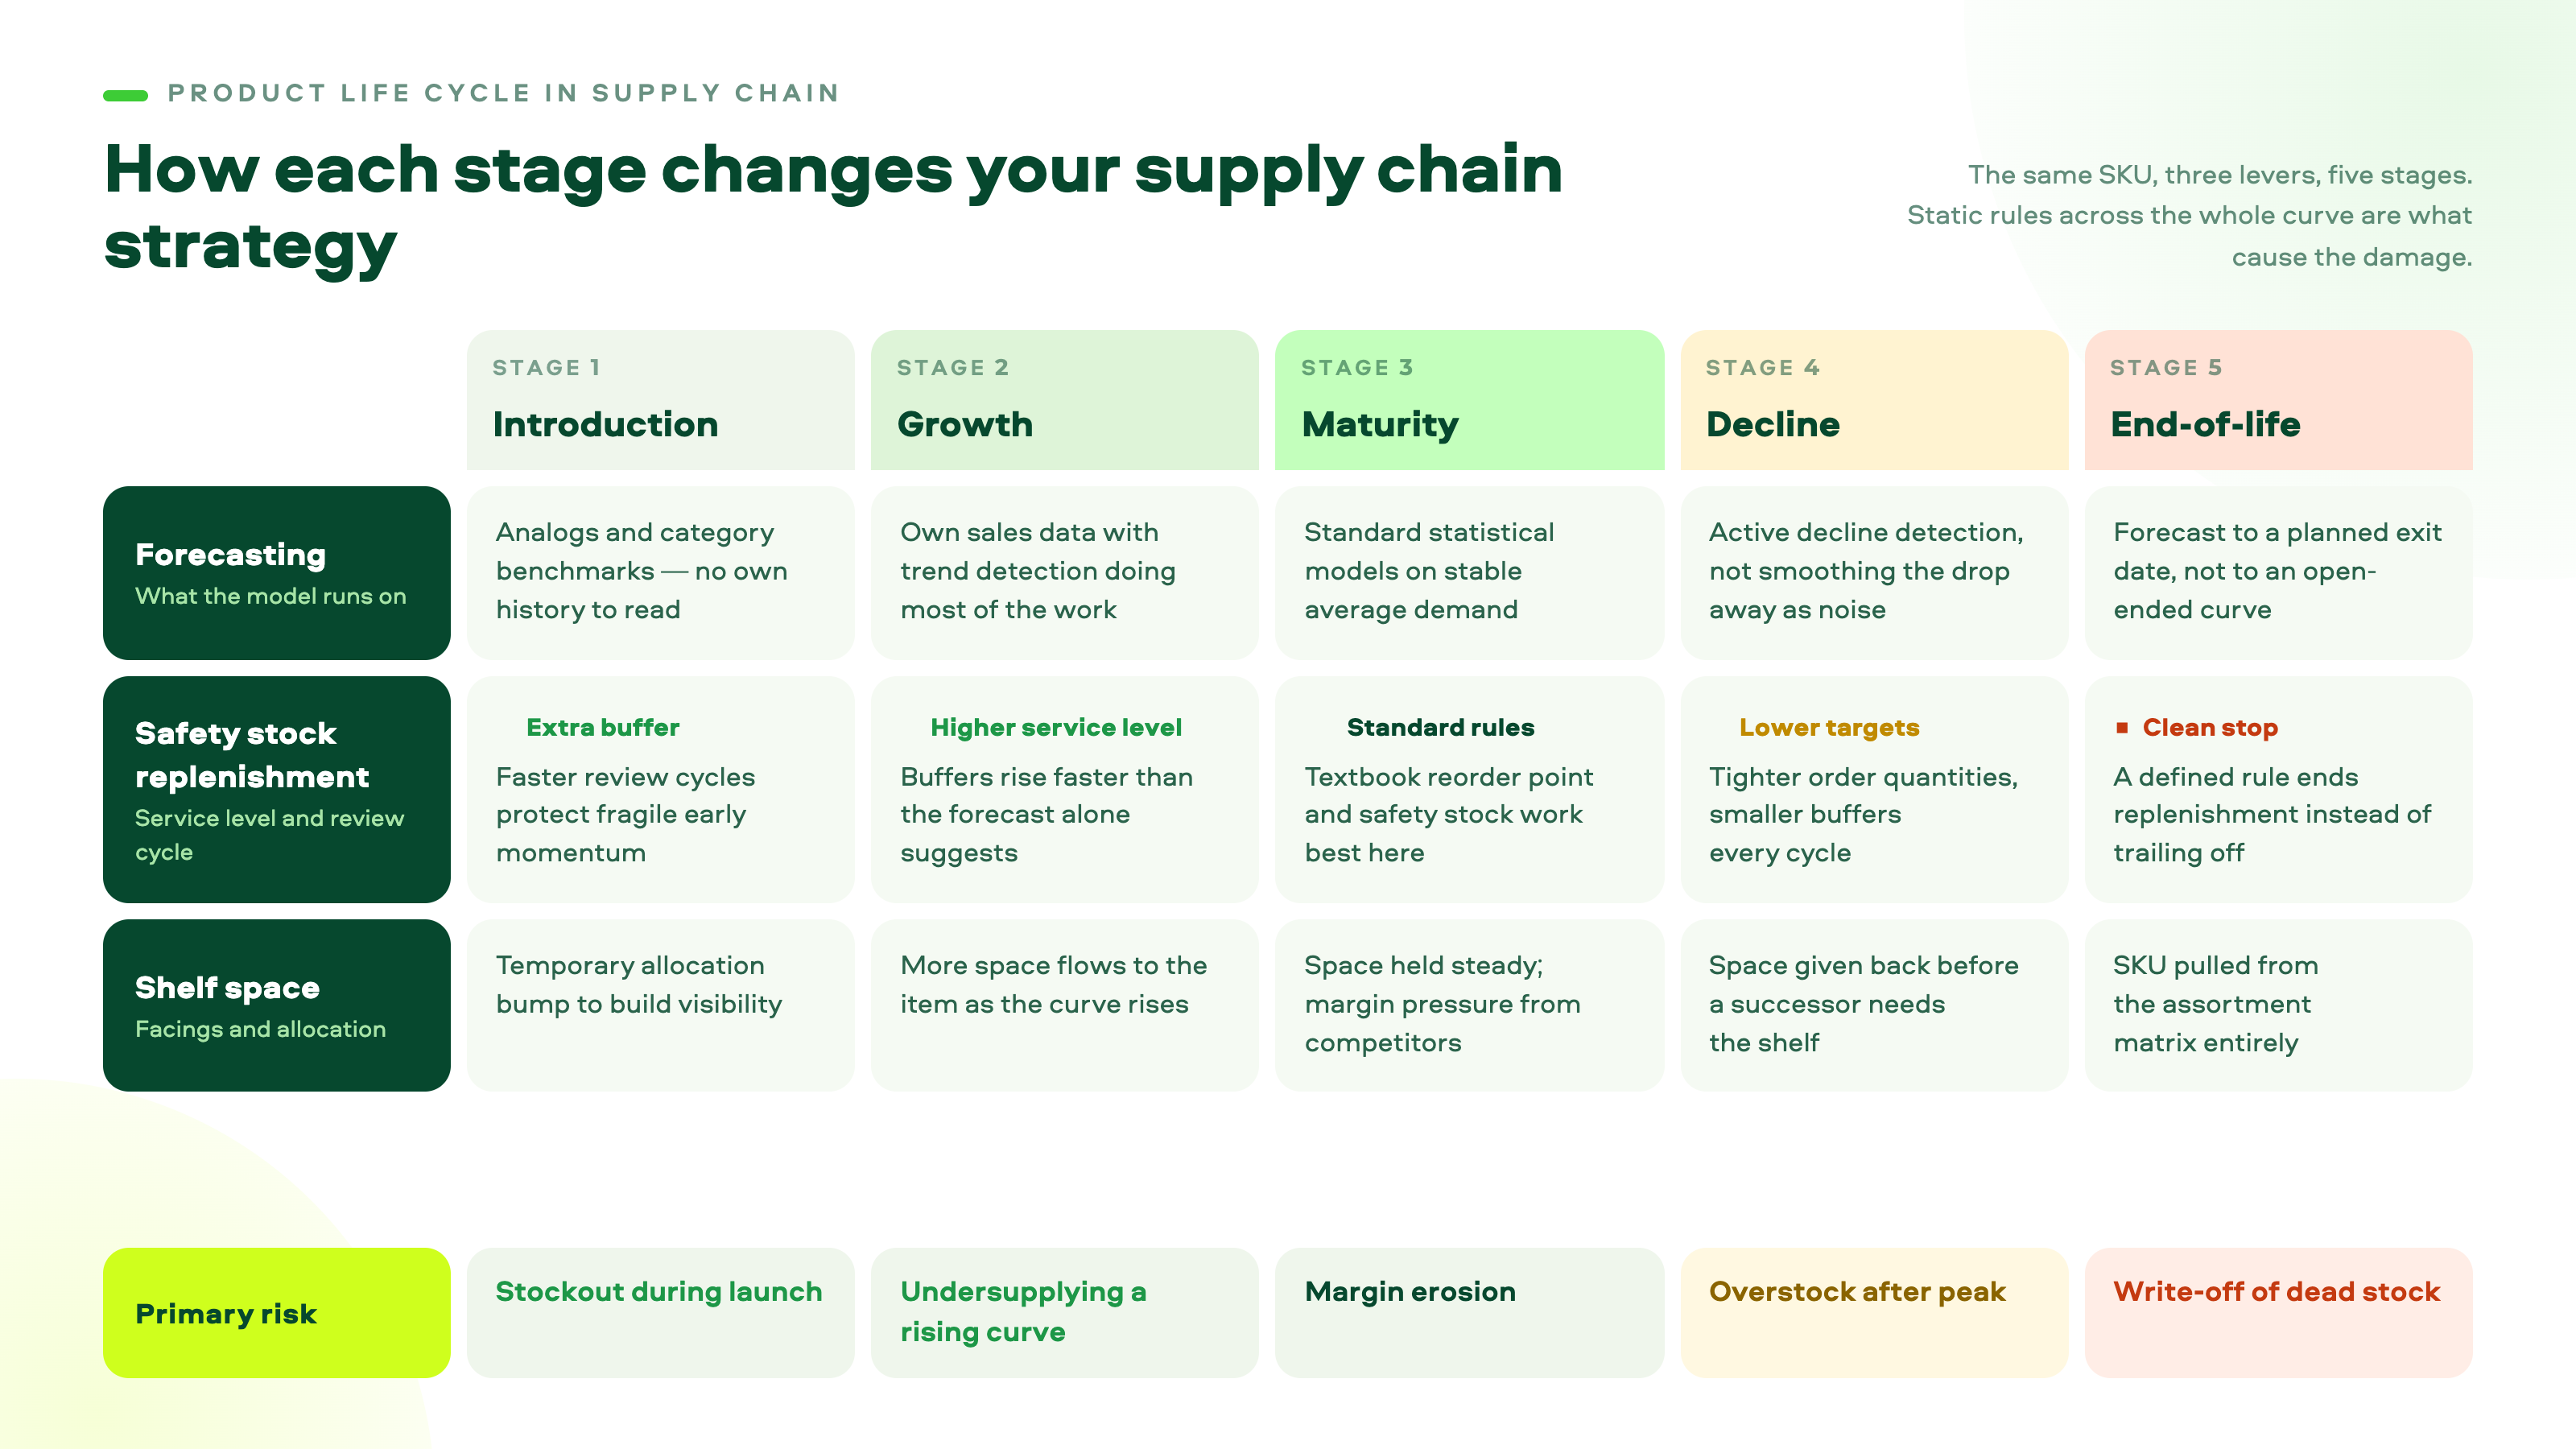
Mapping product lifecycle phases supply chain-wide, rather than SKU by SKU in isolation, catches these shifts before they show up as a margin problem. The mechanics of demand forecasting, replenishment, and shelf space all shift as a product moves through these stages. Supply chain teams that map product lifecycle in inventory management terms, stage by stage, are the ones who catch it in time.
1. Demand forecasting shifts from guesswork to signal reading.
At introduction, forecasting leans on analogs (similar products launched before) rather than the item's own history because there is no history yet. By growth and maturity, the system can rely on its own sales data, with trend detection doing most of the work. By decline, the model needs to actively detect the downturn rather than smooth it away as noise. Otherwise, it will keep recommending stock levels sized for a product that no longer exists in the market it used to.
2. Replenishment logic and safety stock rules change stage by stage
A fixed safety stock formula applied across the whole life cycle either starves a growing product or drowns a declining one. Growth-stage items generally need higher service level targets and shorter review cycles. Decline-stage items need the opposite: lower targets, tighter order quantities, and a clear rule for when replenishment stops altogether, rather than trailing off on autopilot.
3. Assortment and shelf space allocation follow the curve
Space and facing decisions should track the same curve. A new product introduction often gets a temporary space allocation bump to build visibility. More space typically flows to it during growth. It should give that space back once it enters decline, ideally before a slower-moving successor needs the shelf.
The Biggest Supply Chain Risks at Each Product Lifecycle Stage
Most of the financial damage from mismanaging the product life cycle traces back to three recurring failure points. Each one shows up at a different stage, and each one is preventable with the right rules in place.
Risk 1: Understocking during launch
Early stockouts do more damage than the lost sales they represent in the moment. They also slow the repeat-purchase signal a retailer needs to tell whether a launch is working. That, in turn, delays every downstream decision about how much space and stock the product deserves next.
Risk 2: Overstocking after peak
The most common failure mode in mature and declining categories is treating a slowing item as if it were still at full maturity demand. According to IHL Group, inventory distortion, the combined cost of stockouts and overstocks, drains $1.73 trillion from global retail every year. That figure represents 6.5% of global retail sales. A meaningful share of the overstock component traces back to items that had already entered decline while their replenishment rules stayed frozen at maturity settings.
Risk 3: Slow reaction at end-of-life
Retailers that lack a formal process for flagging end-of-life SKUs tend to discover them the same way. A stockroom audit turns one up, or a finance team asks why capital is tied up in a product nobody has reordered in months. By the time that conversation happens, markdown is usually the only lever left. It is also the least profitable one.
How to Make Better Stocking Decisions Across the Product Lifecycle
None of this requires a rebuild of your entire planning process. Two changes account for most of the improvement retailers see once they start treating lifecycle stage as a first-class input.
Advice 1: Automate stage transitions instead of tracking them manually
Manually flagging when an SKU moves from growth to maturity, or from maturity to decline, does not scale past a few hundred items. Most retailers carry thousands. Rules that watch sales velocity, trend direction, and time since introduction can flag a stage change automatically. Buyers then spend their time on decisions instead of bookkeeping.
Advice 2: Set different replenishment and safety stock rules per stage
Rather than one universal formula, define a distinct set of parameters for each stage: target service level, review frequency, and order quantity logic. A product in introduction and the same product eighteen months later in decline should almost never run on identical rules. It is the exact same SKU in the system, but a completely different demand problem.
This is also where SKU rationalization earns its place on the planning calendar, rather than staying a once-a-year cleanup project. Deloitte's 2026 Global Consumer Products Outlook found that about half of surveyed consumer products companies now plan to rationalize SKUs specifically to reduce portfolio complexity. Treating decline-stage cleanup as routine, not exceptional, is becoming standard practice.
The Role of S&OP in Product Lifecycle Management
Sales and operations planning is where lifecycle decisions get cross-checked against the rest of the business. A category manager might spot a product entering decline weeks before finance notices the margin impact. Folding lifecycle status into the regular S&OP cadence keeps merchandising, finance, and supply chain looking at the same picture. That works better than treating it as a separate side conversation.
How AI Helps Manage the Product Life Cycle in Supply Chain
Machine learning models are, in most cases, better suited to lifecycle detection than a person reviewing spreadsheets category by category. They can watch velocity and trend signals across thousands of SKUs at once. That said, AI here is pattern recognition, not magic. It still needs enough signal to work with, which is why the introduction stage remains the hardest one to automate confidently.
According to NielsenIQ, more than 3,500 new brands and sub-brands launched across the UK, Germany, France, Italy, and Spain in 2025. Yet only one third of them reached even 1% of households. That is a lot of new SKUs entering retail assortments with thin early signal. It is exactly the population that benefits most from analog-based forecasting and fast, automated stage detection, once real sales data starts coming in.
How LEAFIO AI Supports Lifecycle-Based Inventory Planning
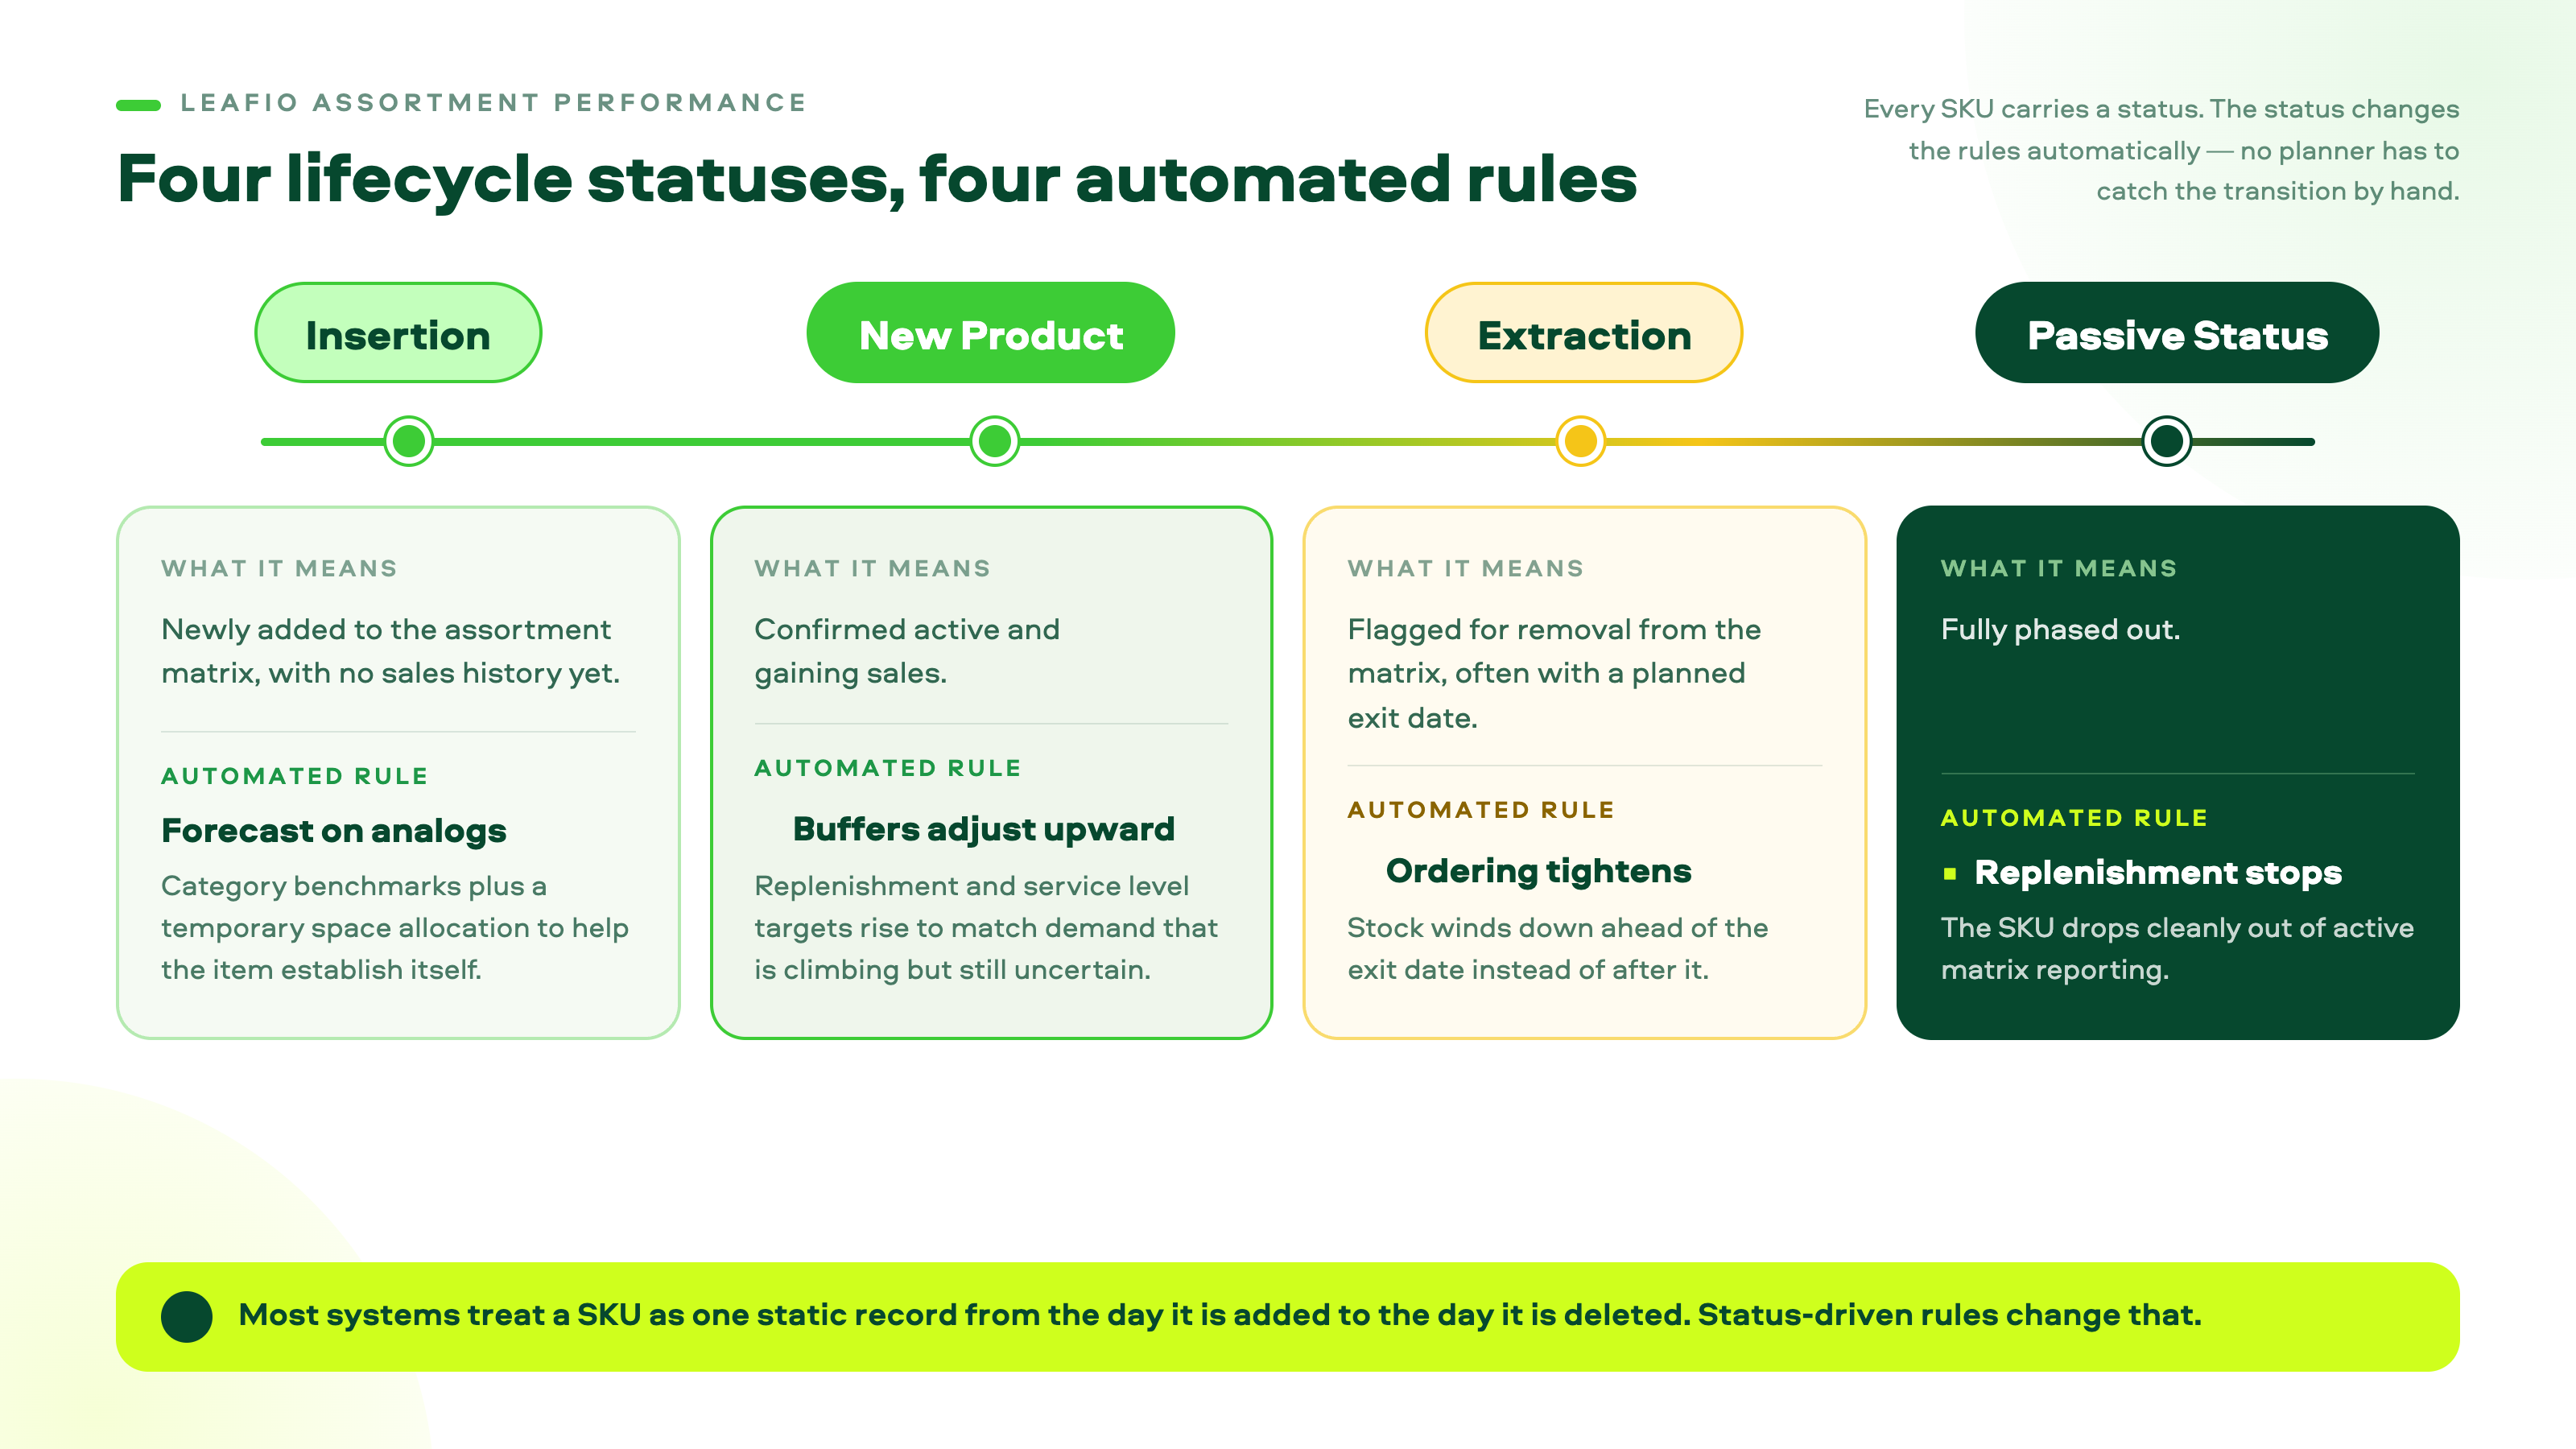
Most inventory systems treat a SKU as a single, static record from the day it is added to the day it is deleted. LEAFIO's Assortment Performance module takes a different approach. It tracks every product through four explicit lifecycle statuses, and each one carries its own automated rules instead of relying on a planner to catch the transition manually.
| Lifecycle status | What it means | The automated rule LEAFIO applies |
|---|---|---|
| Insertion | The SKU is newly added to the assortment matrix, with no sales history yet | Forecasting runs on analogs and category benchmarks; a temporary space allocation helps the item establish itself |
| New Product | The SKU is confirmed active and gaining sales | Replenishment and buffer targets adjust upward to match rising, still-uncertain demand |
| Extraction | The SKU is flagged for removal from the matrix, often with a planned exit date | Ordering tightens automatically, and stock winds down ahead of the exit date instead of after it |
| Passive Status | The SKU is fully phased out | Replenishment stops cleanly and the SKU drops out of active matrix reporting |
This kind of retail assortment management, where lifecycle status drives the rules automatically, shows up in the results of retailers running it at scale.
MasterZoo, a European pet retail chain running 200+ stores and 6,000+ active SKUs, replaced a fixed, hard-to-adjust clustering setup with LEAFIO Assortment Performance paired with LEAFIO Inventory Optimization. Matrix updates that used to take multiple manual steps per SKU became 1 to 2 clicks, cutting matrix update time by 150% and manual labor in assortment operations by roughly 50%. Planned SKU exit dates let the chain wind down a product's stock on schedule, rather than discovering dead SKUs after the fact. That is the extraction status in practice, and it helped cut out-of-matrix items by 20 to 25%.
Felicia, a multi-brand pharmacy group operating 337 pharmacies across Eastern Europe, faced a related problem at a different scale. Roughly 15,000 active SKUs had their assortment matrices built and maintained by hand in Excel by five category managers. After moving to LEAFIO Assortment Performance, SKU add and remove decisions became analytics-driven instead of request-driven. Out-of-matrix stock is now tracked automatically, with daily fill-rate reporting instead of a stock check months later. Felicia's rollout is still in its post-launch measurement window. The chain expects a trajectory similar to MasterZoo's once its matrix runs at full scale across all 337 locations.
AI-powered demand planning that already accounts for lifecycle stage made the difference in both cases. Products enter and leave the assortment at different speeds, and that is the same underlying challenge in each one. Paired with inventory replenishment automation tuned to each stage's rules, it turned that challenge into the matrix speed and labor gains above.
If your team is still tracking lifecycle stage in a spreadsheet next to the item master, that gap is worth closing. Book a walkthrough of LEAFIO's Assortment Performance module to see how the status-based rules would apply to your own SKU base.
FAQ
What are the stages of the product life cycle in supply chain management?
Most retail supply chains track four to five stages: introduction, growth, maturity, decline, and end-of-life or phase-out. From an inventory planning standpoint, these four market-facing stages are what drive forecasting and replenishment decisions.
How does a product lifecycle affect inventory management?
Each stage carries a different demand pattern and risk profile. Introduction needs analog-based forecasting and tight stockout protection. Growth needs rising buffer levels. Maturity runs on standard reorder logic. Decline needs shrinking buffers and a clear exit plan before stock turns obsolete.
Product lifecycle management vs. supply chain management: What is the difference?
Product lifecycle management, in the engineering sense, covers how a product is designed, engineered, and documented before and during manufacturing. Supply chain management covers how it gets planned, stocked, and moved once it exists. Retail product life cycle management in supply chain sits inside the second category. It treats lifecycle stage as a demand signal, not a design process.
How do you manage end-of-life inventory in a supply chain?
Stop or taper replenishment before the stage actually hits zero demand. Redistribute remaining stock to locations where it can still sell. Set a markdown or clearance trigger tied to a time or inventory-age threshold, rather than waiting for a manual review to catch it.
What challenges come up during the product introduction phase in the supply chain?
The core challenge is forecasting with no sales history. Retailers typically lean on analog products, supplier launch data, or category benchmarks. They also build in extra safety stock or faster review cycles until enough real sales data accumulates to trust the model on its own.
How does the product life cycle affect demand forecasting strategy?
Forecasting models need different inputs at each stage. Early on, that means analogs and qualitative signals. During growth and maturity, trend-following statistical models take over. Later, the model needs active decline detection, since a model tuned for stable demand will lag badly once a product starts falling off.
How do product life cycle stages impact replenishment decisions?
Review frequency, safety stock targets, and order quantities should all shift with the stage. Static replenishment rules applied across the whole life cycle are the single biggest reason retailers end up stocking out during growth or sitting on markdown inventory during decline.
What is product cannibalization in supply chain planning?
Cannibalization happens when a new product's sales come partly at the expense of an existing one, usually a predecessor or a close substitute. It matters for lifecycle planning because it can push an older SKU into decline faster than its own sales trend would suggest. The two products need to be forecast together, not in isolation.


Have a question?

Kristi Miller
Retail optimization expert