Average inventory and their structure
It is vital to pay attention to the structure of stocks: whether a significant amount of money is frozen in surplus or the display of goods.
Retail inventory management dashboard is a functional tool that allows a manager to focus on the essentials and understand the problems at a glance without a deep analysis. Keeping the interface intuitive and user-friendly, it gives a quick assessment of the inventory status and the manager’s tasks.
Helps to view weekly KPI analytics
Strategic AI inventory management dashboard for retail provides top-level analysis of inventory, sales, availability and turnover, their dynamics, and also the efficiency of using the system and accuracy in sending order assessments; offers the manager insights in inventory management, which can show obscure problem areas without deep analytics.
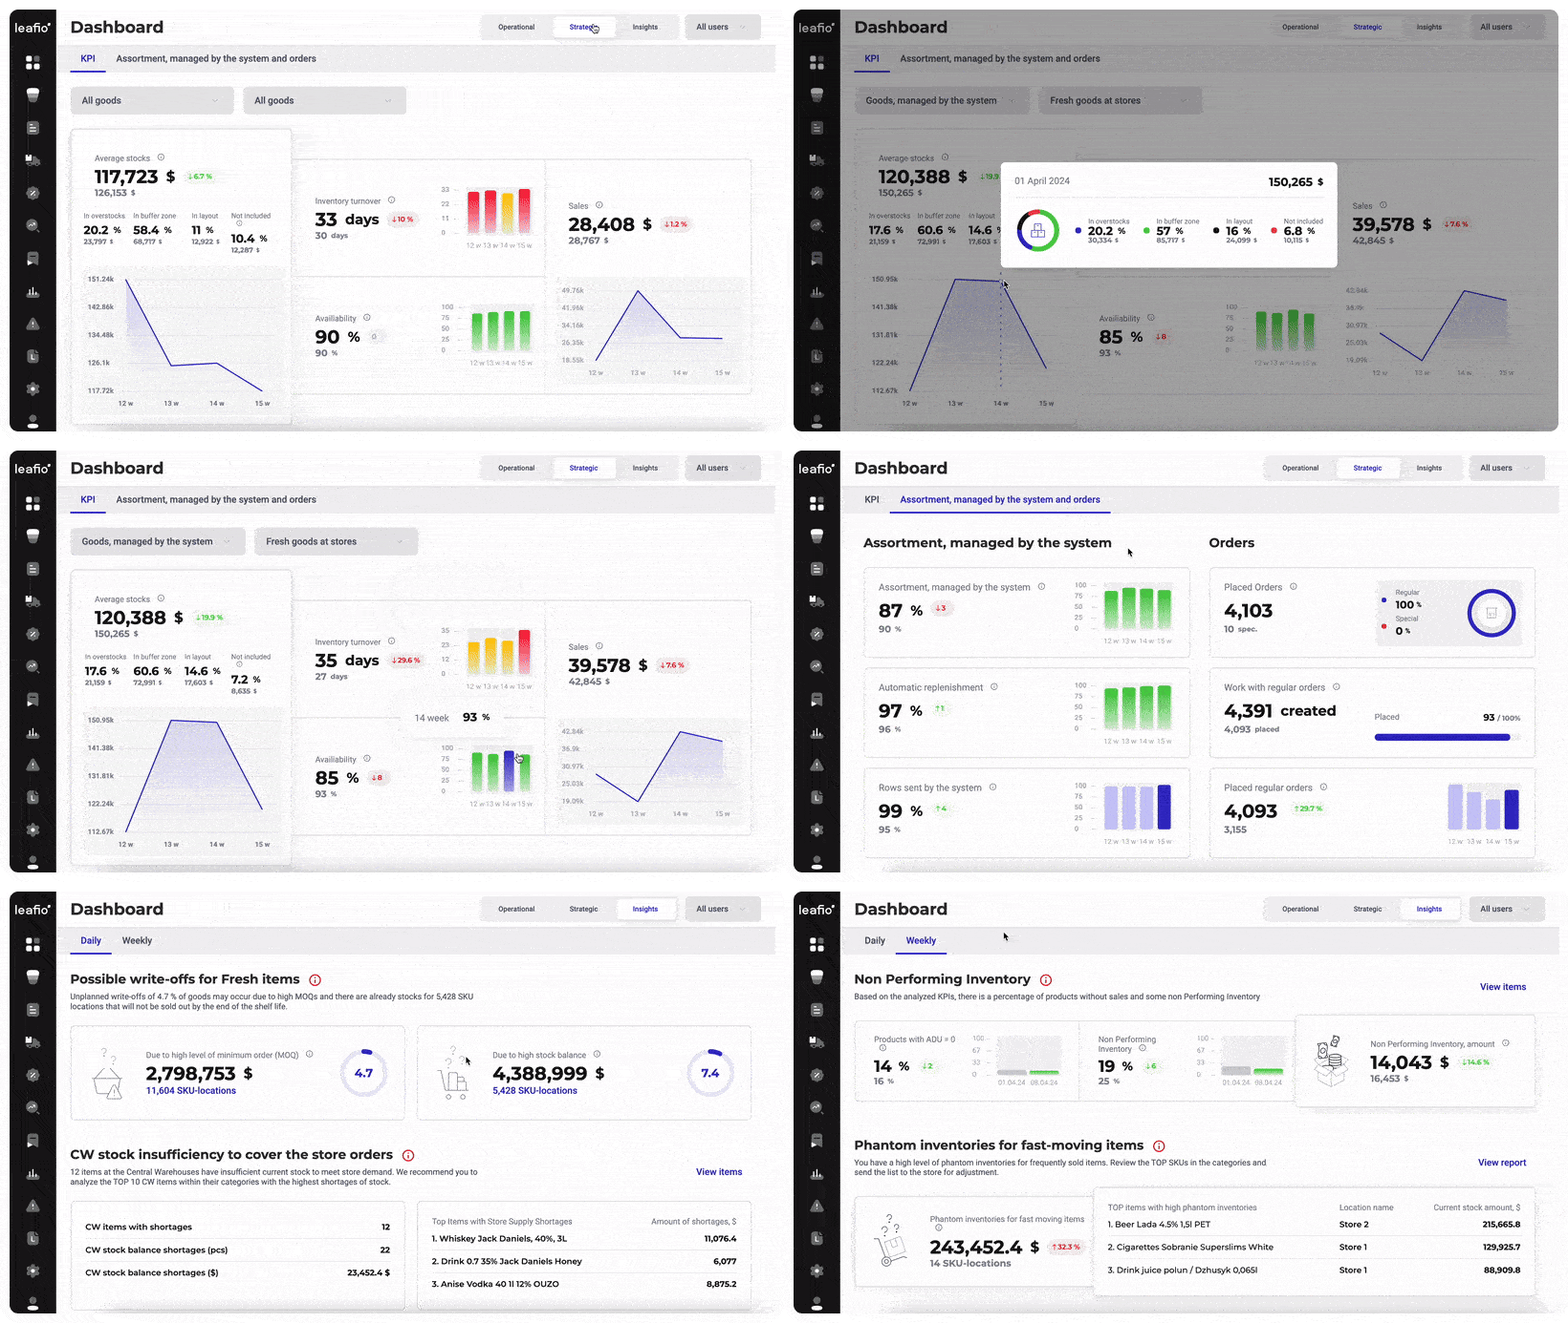
It is vital to pay attention to the structure of stocks: whether a significant amount of money is frozen in surplus or the display of goods.
Quickly figures out which sales are declining: regular or promotional. This will help you instantly determine where to look for the cause.
Stockout tracking helps identify sales declines caused by empty shelves or poor merchandising, showing how product availability directly impacts revenue.
A performance indicator that primarily depends on sales dynamics and average inventory.
Helps evaluate the efficiency of using the system by the chain, i.e. the range percentage ordered via LEAFIO Inventory Optimization.
Shows you if you are really using all the system's features for your business.
Shows you the extent of users' interference with the system.
Retail inventory dashboard provides insight into the total number of orders generated by the system, how many of them were sent to suppliers and the percentage ratio of orders generated by the system to orders created manually.
Using methodologically sound approaches, the system provides not just information but a problem that has already been analyzed, which can have a severe impact on the business.
The system highlights not only the percentage of dead stocks but also calculates how much money is frozen at the precise moment, making it possible to redistribute the budget correctly. So, by getting rid of slow movers, you can allocate funds for further business development.
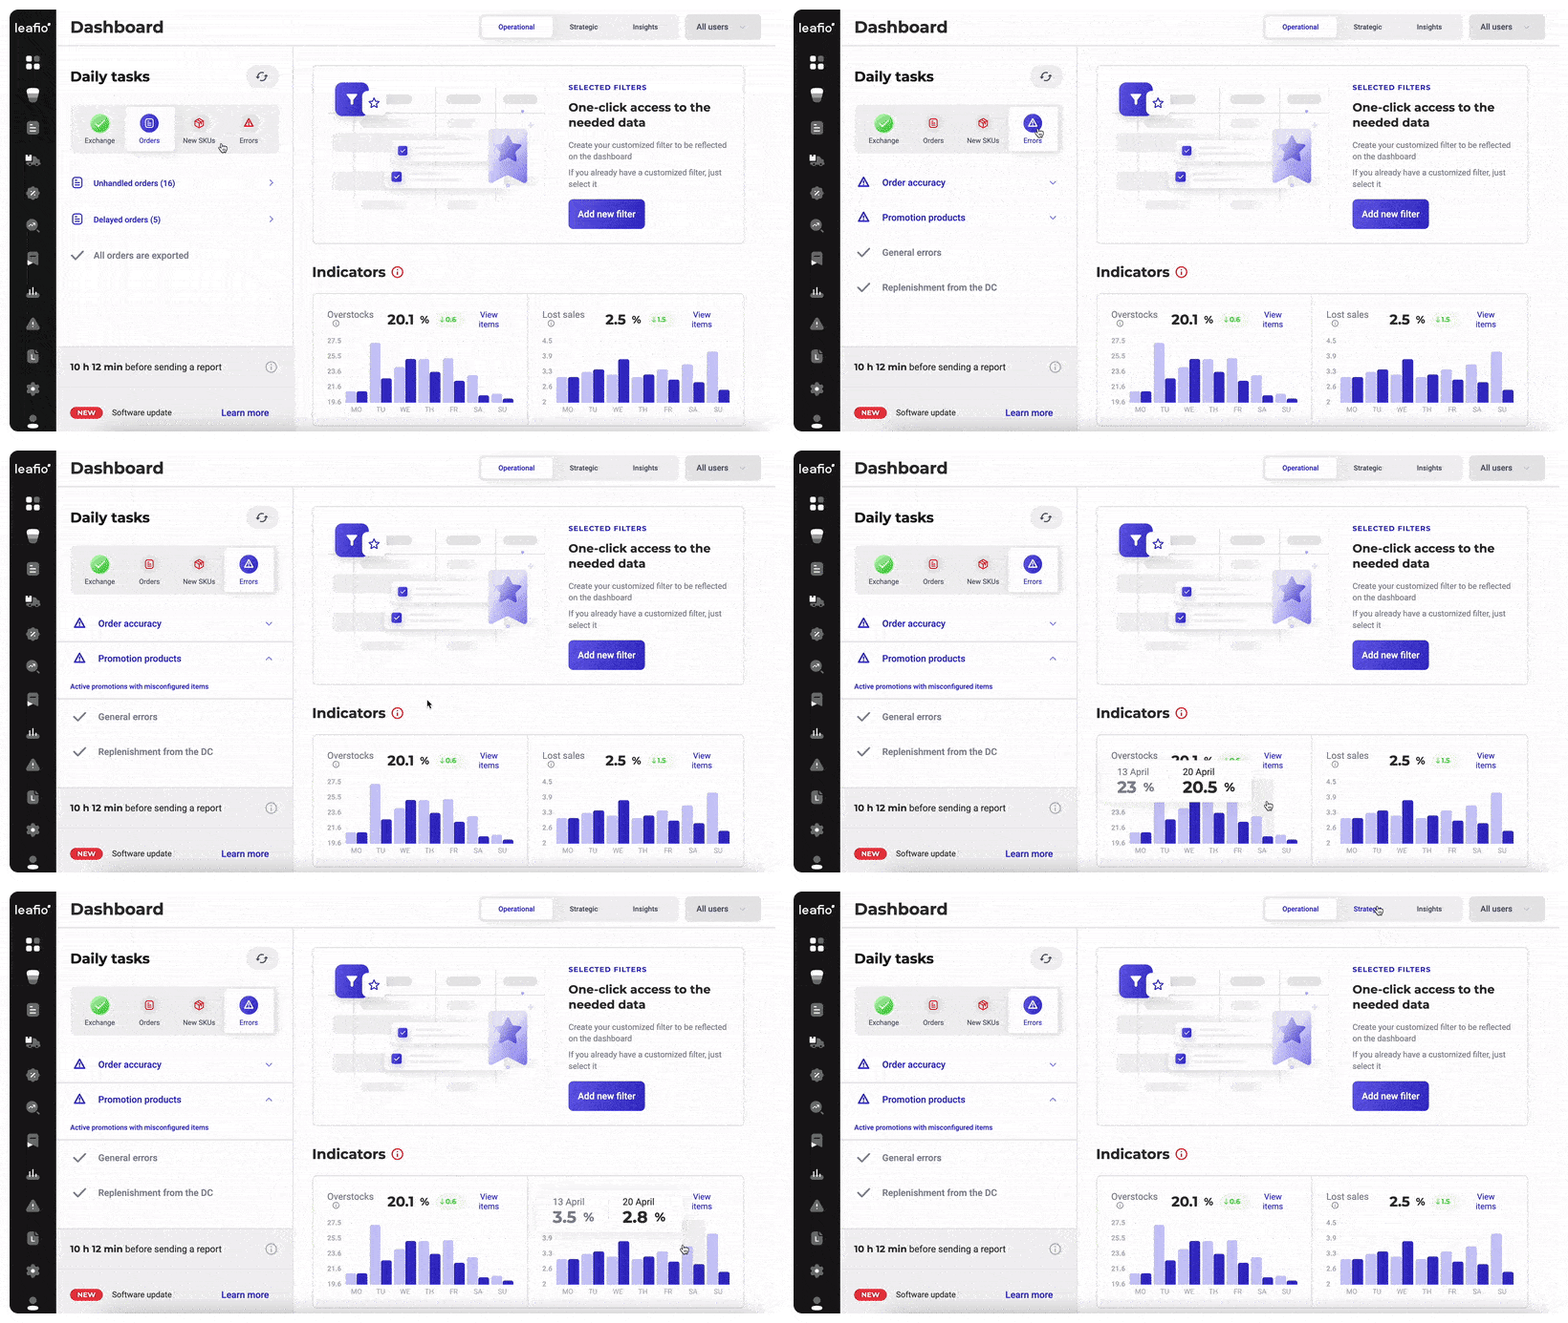
Operational inventory analytics dashboard for the demand planner, focusing on assortment and personal tasks; personalized system blocks that a manager uses most often. Provides the manager with a current list of tasks and shows on a daily basis how specific surplus and lost sales indicators have changed in the LEAFIO Inventory Optimization system. In the case of negative dynamics, the system offers an additional report which helps you to understand the cause of the trend. From the operational dashboard, you can go immediately to any application page with specifically customized filters.
Behind every number: forecasts recalculated, buffers rebuilt, orders generated and sent.
Explore Inventory Optimization SolutionInventory dashboard data gives top management a clear understanding of the system uptake, how much it helps the business, and what part of the routine tasks it covers.


















We’re happy to discuss your business’s needs and share how LEAFIO’s market-leading, unified platform can help you drive profitable growth across your sales and distribution channels.
Balancing levels is only as good as the demand behind it. These modules build that demand picture and measure how well the network stayed balanced.
Learn moreAnalytics is only useful next to the processes it evaluates. These are the modules that generate the numbers in every report.
Learn moreSeasons are one kind of demand peak. These modules cover the rest of the picture — promotional uplift, weekly ordering cycles, and categories measured in days of shelf life rather than months.
Learn moreA retail inventory management dashboard provides a centralized view of stock performance across stores, warehouses, and channels. Instead of checking multiple reports, managers quickly understand availability risks, slow-moving items, and sales trends, helping teams react faster when inventory decisions directly affect revenue.
Spreadsheets require manual updates and often show outdated information. AI dashboards automatically analyze demand patterns and operational signals, helping teams detect risks earlier. Unlike static files, user-friendly dashboards highlight priorities instantly, allowing managers to focus on decisions rather than data preparation.
Retailers usually monitor availability rates, turnover speed, overstocks, margin impact, and replenishment status. A strong retail analysis dashboard connects these indicators in one view, helping teams understand not only what is happening with inventory but also why performance changes across stores or categories.
Yes. Multi-location retailers typically rely on centralized visibility showing store comparisons, demand changes, and execution gaps. Many retail dashboard examples demonstrate how headquarters can monitor performance across dozens or hundreds of locations without waiting for manual reports from individual store managers.
Yes. Different retailers prioritize different metrics depending on category strategy or growth stage. Custom dashboards allow teams to focus on availability, margin protection, or supplier performance, similar to a retail order management dashboard that adapts insights to operational workflows rather than forcing fixed reporting formats.
Excess stock often accumulates because problems are discovered too late. A retail inventory tracking dashboard highlights slow-moving items and demand shifts early, allowing teams to rebalance stock or adjust ordering decisions before capital becomes frozen in warehouses or clearance discounts.
Yes. Instead of reacting to empty shelves, predictive monitoring identifies declining stock trends and demand spikes early. This helps retailers prevent lost sales and customer frustration by acting before shortages appear, especially across large networks managing complex reatil inventory flows.
Seasonal demand changes quickly, making manual planning risky. Dashboards analyze historical trends alongside current performance signals, helping planners prepare inventory earlier. Retailers gain confidence ordering the right quantities before peak periods, reducing emergency shipments and avoiding leftover stock after the season ends.


