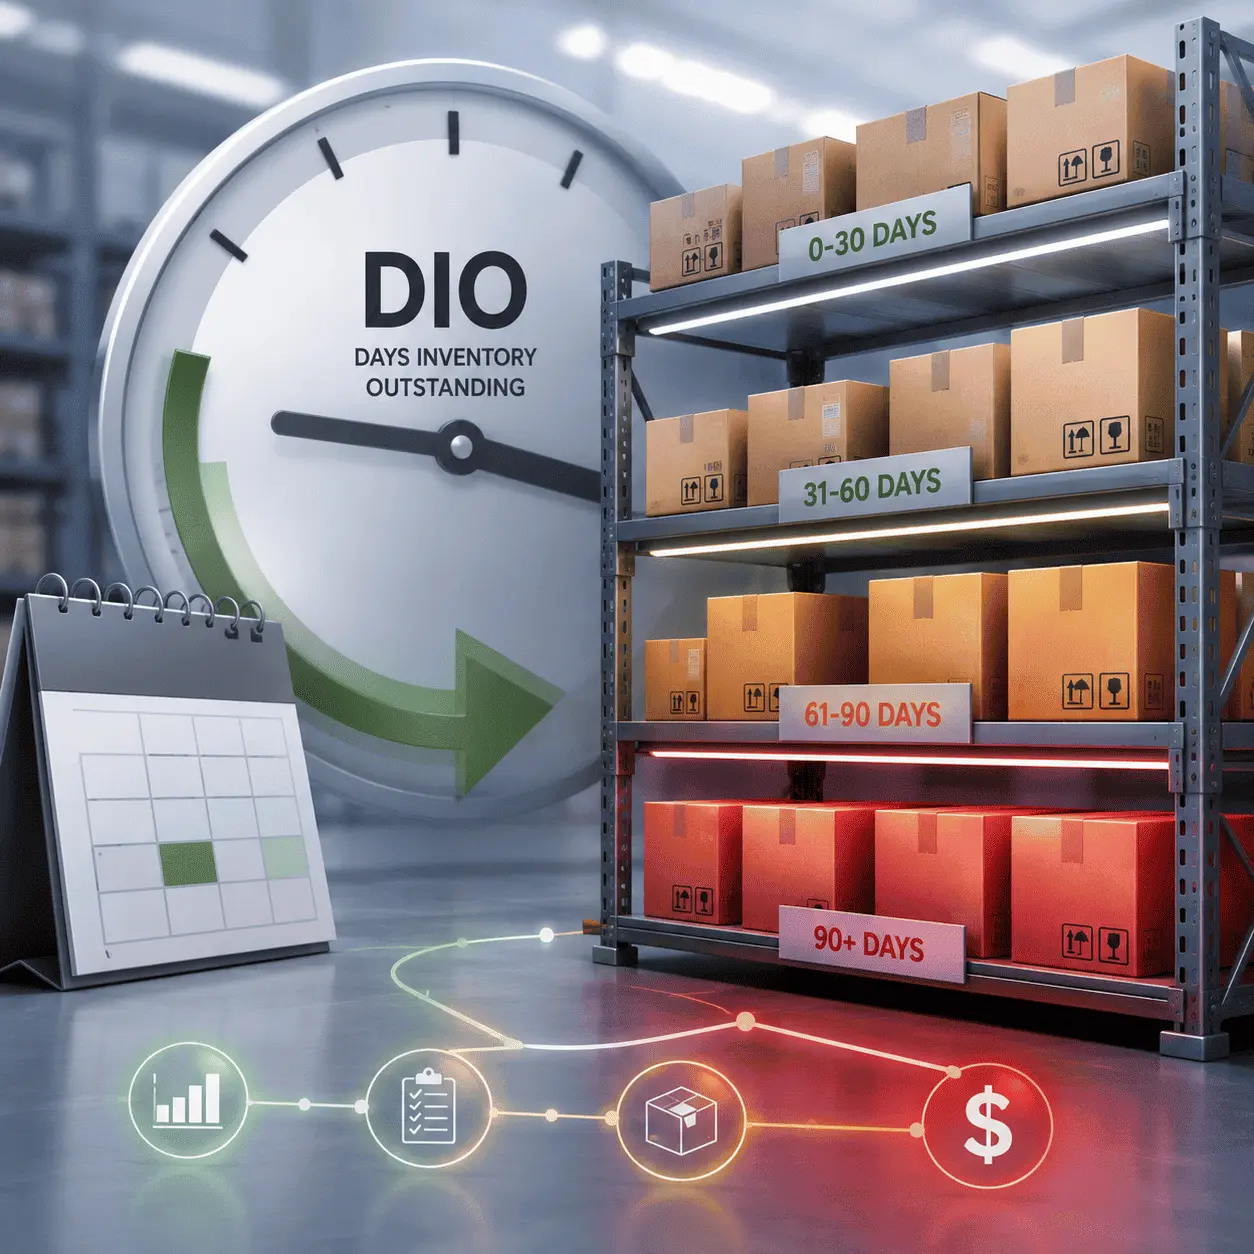


A pallet of slow-moving stock sitting in a warehouse for an extra three weeks doesn't look like a problem. It looks like inventory. But every one of those extra days is cash that's frozen instead of working for you. Days inventory outstanding (DIO) is the number that puts a figure on exactly how frozen it is. According to IHL Group, inventory distortion, the combined cost of overstocks and out-of-stocks, now costs global retail $1.73 trillion a year. That's equal to about 6.5% of global retail sales, and a good share of it traces back to inventory sitting in the wrong place for too long. DIO tells you, on average, how many days pass between buying or producing a unit of stock and selling it through. For a grocery chain running 15 to 20 turns a year, a two-day slip in DIO across the whole assortment can mean six figures of tied-up cash. For a DIY retailer holding slower-moving SKUs, the swing can be even bigger. This guide covers the formula, what a healthy DIO looks like by industry, and the levers that actually move it, not just the theory behind it.
What Is Days Inventory Outstanding (DIO)?
Days inventory outstanding measures the average number of days a company holds inventory before it sells through. You'll see it under a handful of names depending on the source. Days sales of inventory (DSI), inventory days outstanding, days in inventory, the DIO inventory metric, and the days inventory outstanding ratio all describe the same calculation. DIO is one of three components that make up the cash conversion cycle (CCC), alongside days sales outstanding (DSO) and days payable outstanding (DPO).
A lower DIO generally means inventory is moving fast and cash isn't sitting idle on a shelf. A higher DIO means the opposite: capital tied up, storage costs accumulating, and, depending on the category, markdown risk climbing by the week.
How to Calculate Days Inventory Outstanding: Formula & Step-by-Step Example
Before you can improve DIO, you need a number you trust. If you want to know how to calculate DIO for your own store network, the days inventory outstanding formula only needs two inputs. You probably already have both.
DIO Formula
Days Inventory Outstanding (DIO) = (Average Inventory ÷ Cost of Goods Sold) × Number of Days in Period
Average inventory comes straight off the balance sheet: it's (beginning inventory + ending inventory) ÷ 2.
Cost of goods sold (COGS) should come from the same period you're measuring. Use 365 for an annual view or 90 for a quarterly one. Retailers with strong seasonality (holiday goods, garden centers, back-to-school) get a more honest read from a monthly average inventory figure. A single beginning-and-ending snapshot can be skewed by one large pre-season buy.
Step-by-Step Calculation Example
Here's a days inventory outstanding example using real numbers. Take a mid-size grocery retailer with $2.4 million in beginning inventory, $2.6 million in ending inventory, and $18.25 million in annual COGS.
1. Average inventory: ($2.4M + $2.6M) ÷ 2 = $2.5M
2. Divide by COGS: $2.5M ÷ $18.25M ≈ 0.137
3. Multiply by 365: 0.137 × 365 ≈ 50 days
This retailer holds inventory for roughly 50 days before it sells through, on average, across the full assortment. That's sometimes called the days of supply DIO calculation, since it estimates how many days of supply are sitting on hand. The average also hides a lot of variation. Fresh produce might turn in three to four days while slower center-store SKUs sit for 90 or more.
DIO via Inventory Turnover (Alternative Method)
If you already track inventory turnover ratio, you can back into DIO without recalculating from scratch:
DIO = 365 ÷ Inventory Turnover Ratio
Take a retailer turning inventory 12 times a year. That works out to a DIO of roughly 30 days (365 ÷ 12). This shortcut is useful when benchmarking against public competitors since turnover ratio is usually the figure reported in annual filings.
How to Interpret DIO: What High and Low Numbers Mean
DIO on its own is neither good nor bad. It only means something next to your category, your business model, and your own history.
What Does a High DIO Mean?
A rising or high DIO usually points to overstocking, slow-moving SKUs that never got trimmed from the assortment, or a forecast that's drifted out of sync with demand. It's not automatically a crisis. A DIY retailer stocking bulky, low-turnover categories will naturally run higher than a convenience store. But a DIO that keeps climbing quarter over quarter, with no seasonal explanation, is worth a closer look at reorder points and dead stock.
What Does a Low DIO Mean?
A low DIO usually signals tight, demand-matched ordering and efficient turnover, which frees up cash for other things. But there's a floor past which "low" turns into "risky." Shelves that are chronically thin, rather than tightly forecasted, mean you're trading inventory costs for lost sales. And lost sales tend to be the more expensive problem in most retail categories.
What Is a "Good" DIO?
There's no single healthy number. It depends entirely on the category. A liquor retailer and a fresh produce chain have structurally different "good" DIOs, because their shelf life, purchase frequency, and supplier lead times aren't comparable. The useful benchmark isn't an absolute figure. It's your own trend line against your category's typical range (covered next) and against your direct competitors.
DIO Benchmarks by Industry
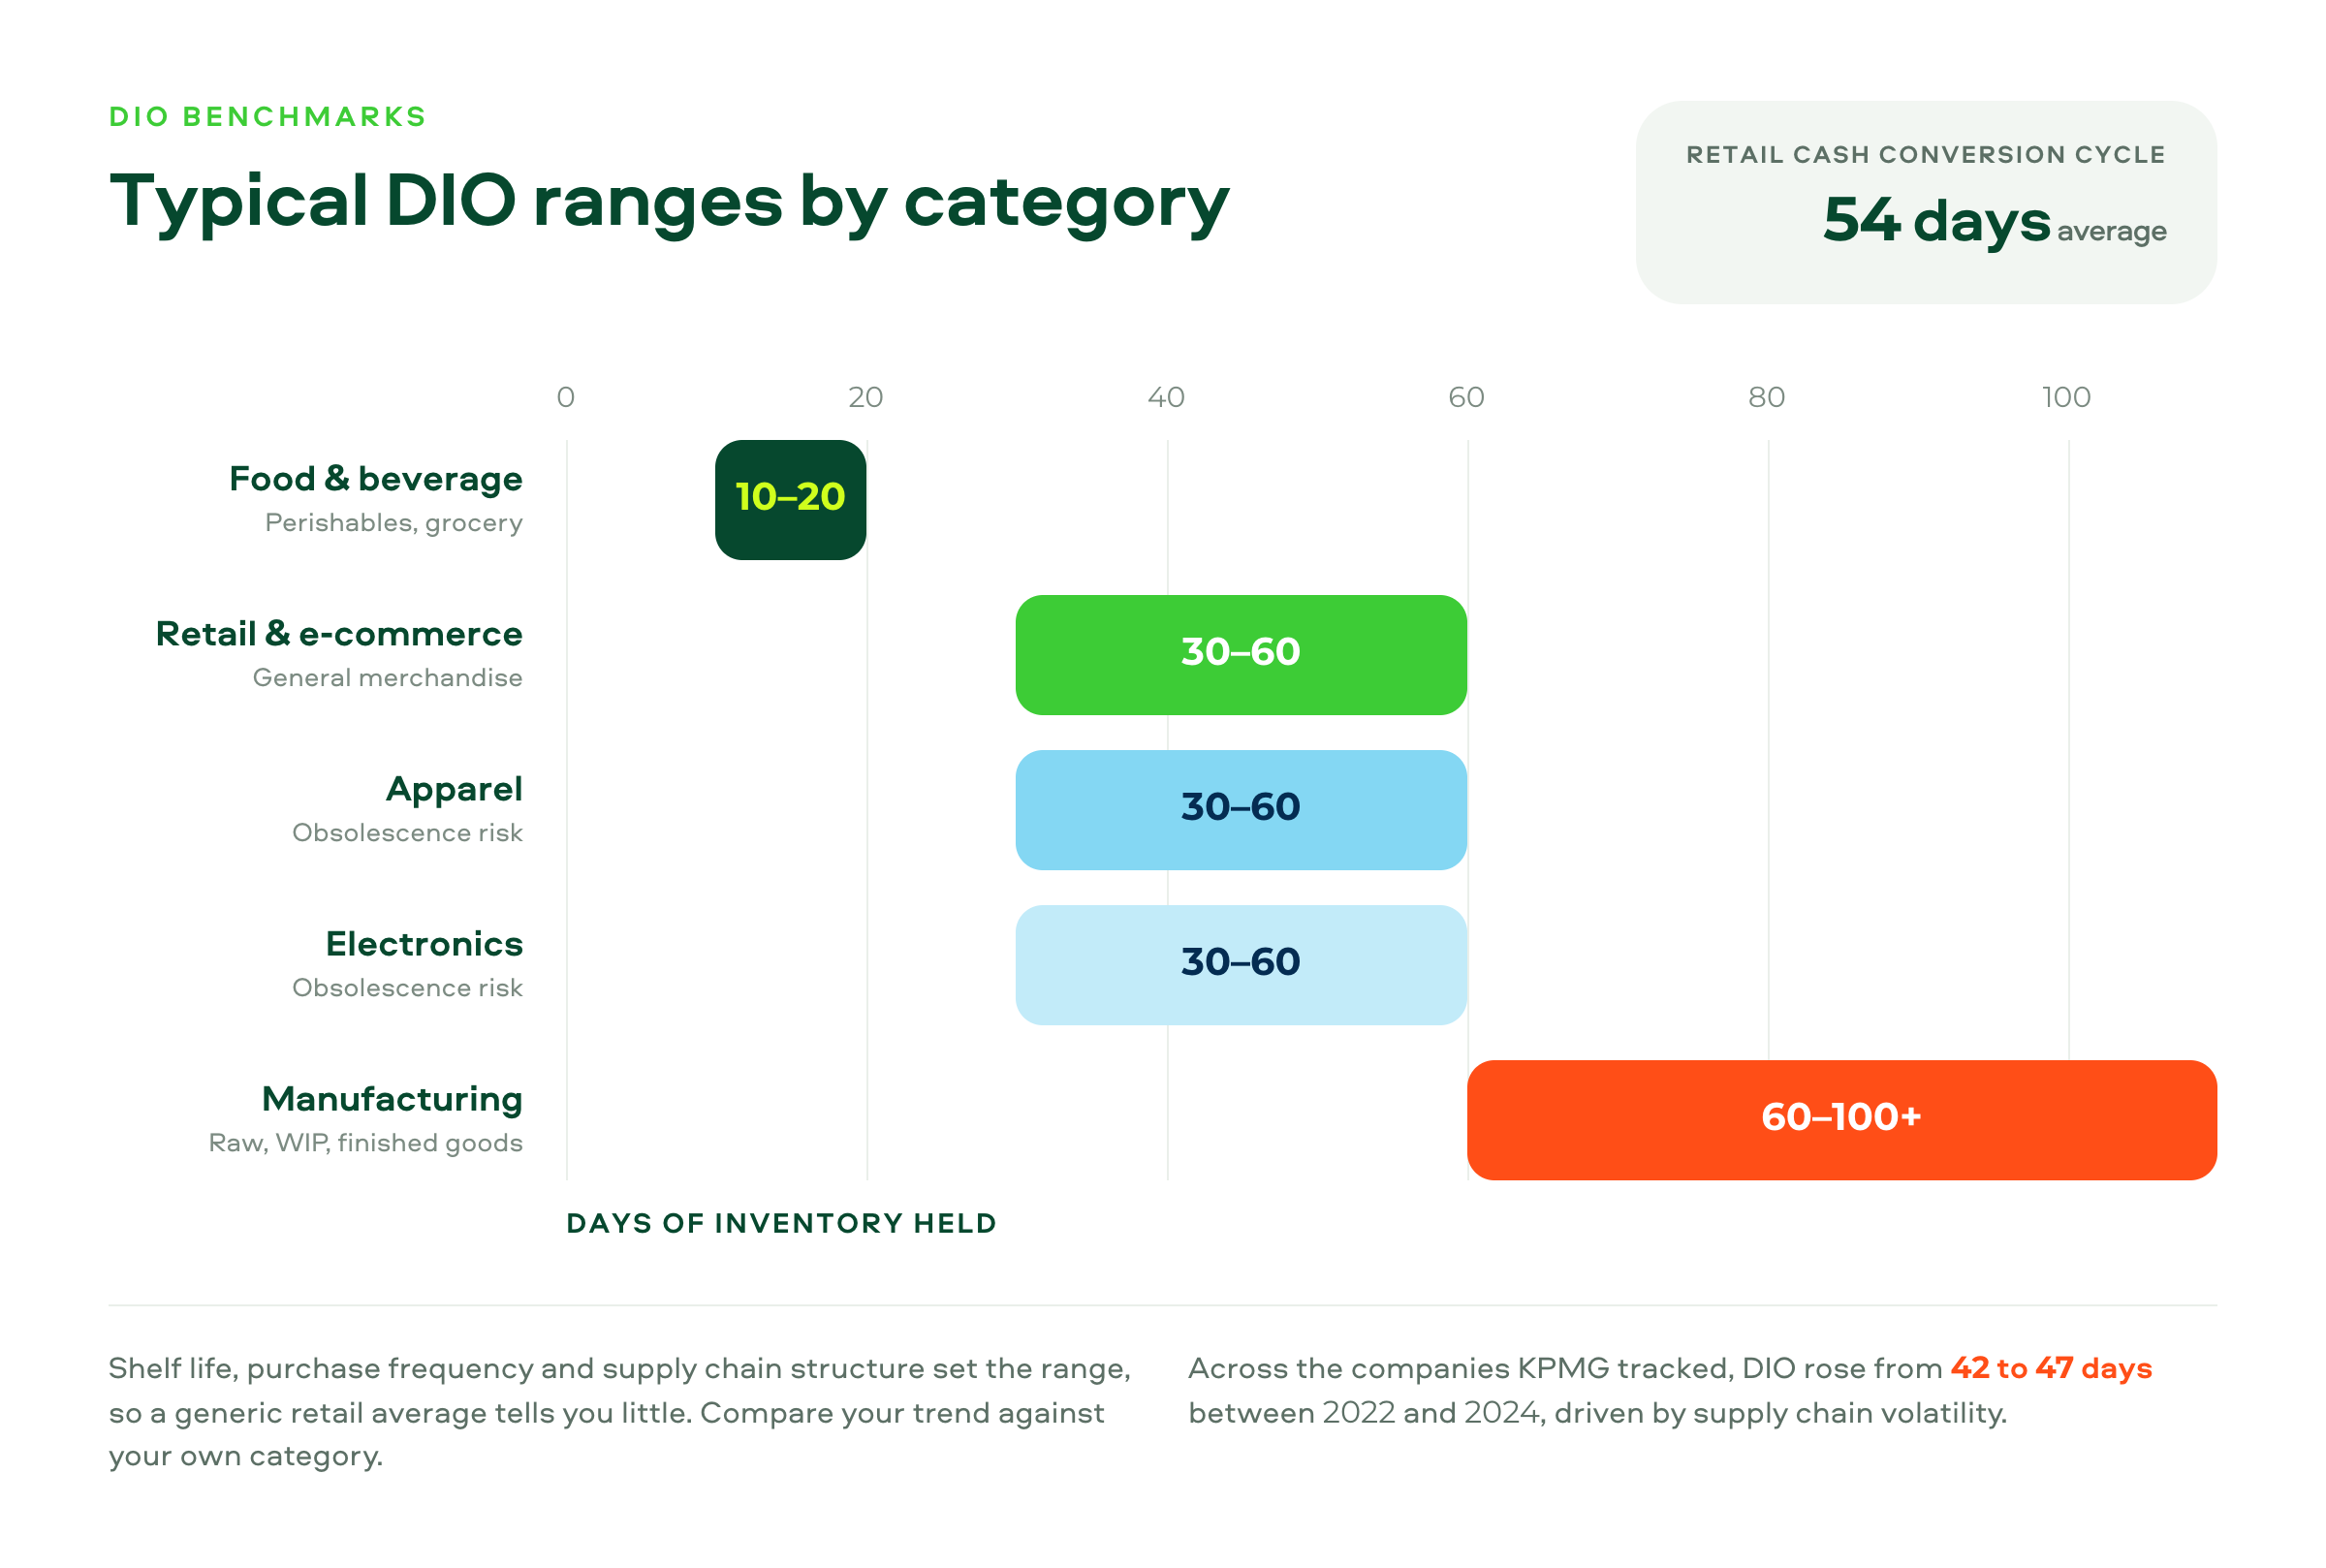
Because DIO is driven by shelf life, purchase frequency, and supply chain structure, comparing your number to a generic "retail average" is close to meaningless. A recent KPMG analysis of more than 300 companies found the average cash conversion cycle sits at 54 days for retail overall. The range inside individual sectors runs far wider than that headline figure suggests.
Retail & E-commerce
General merchandise and e-commerce retailers typically run somewhere in the 30 to 60 day range. Fast fashion and promotion-heavy categories push toward the lower end when replenishment is well-tuned.
Manufacturing
Manufacturers commonly sit at 60 to 100-plus days. Raw materials, work-in-progress, and finished goods all get counted in the inventory figure before a single unit reaches a customer.
Food & Beverage
Perishables and grocery categories run leanest, often 10 to 20 days, because shelf life forces fast turnover regardless of what the forecast says. This is also the category where getting DIO wrong costs the most. Excess inventory doesn't sit around waiting for a markdown. It spoils.
Apparel & Electronics
Apparel and electronics typically land between 30 and 60 days, but both carry heavy obsolescence risk. A new phone launch or a season change can turn slow-moving stock into dead stock within weeks. The acceptable ceiling here is lower than the raw range suggests.
DIO and the Cash Conversion Cycle: The Financial Link
DIO doesn't live in isolation. It's the first input into the cash conversion cycle, the metric that shows how long your cash is tied up in operations before it comes back to you. It belongs on the same dashboard as the other financial KPIs finance teams already track.
DIO, DSO, and DPO: How They Connect
Cash Conversion Cycle = DIO + DSO − DPO
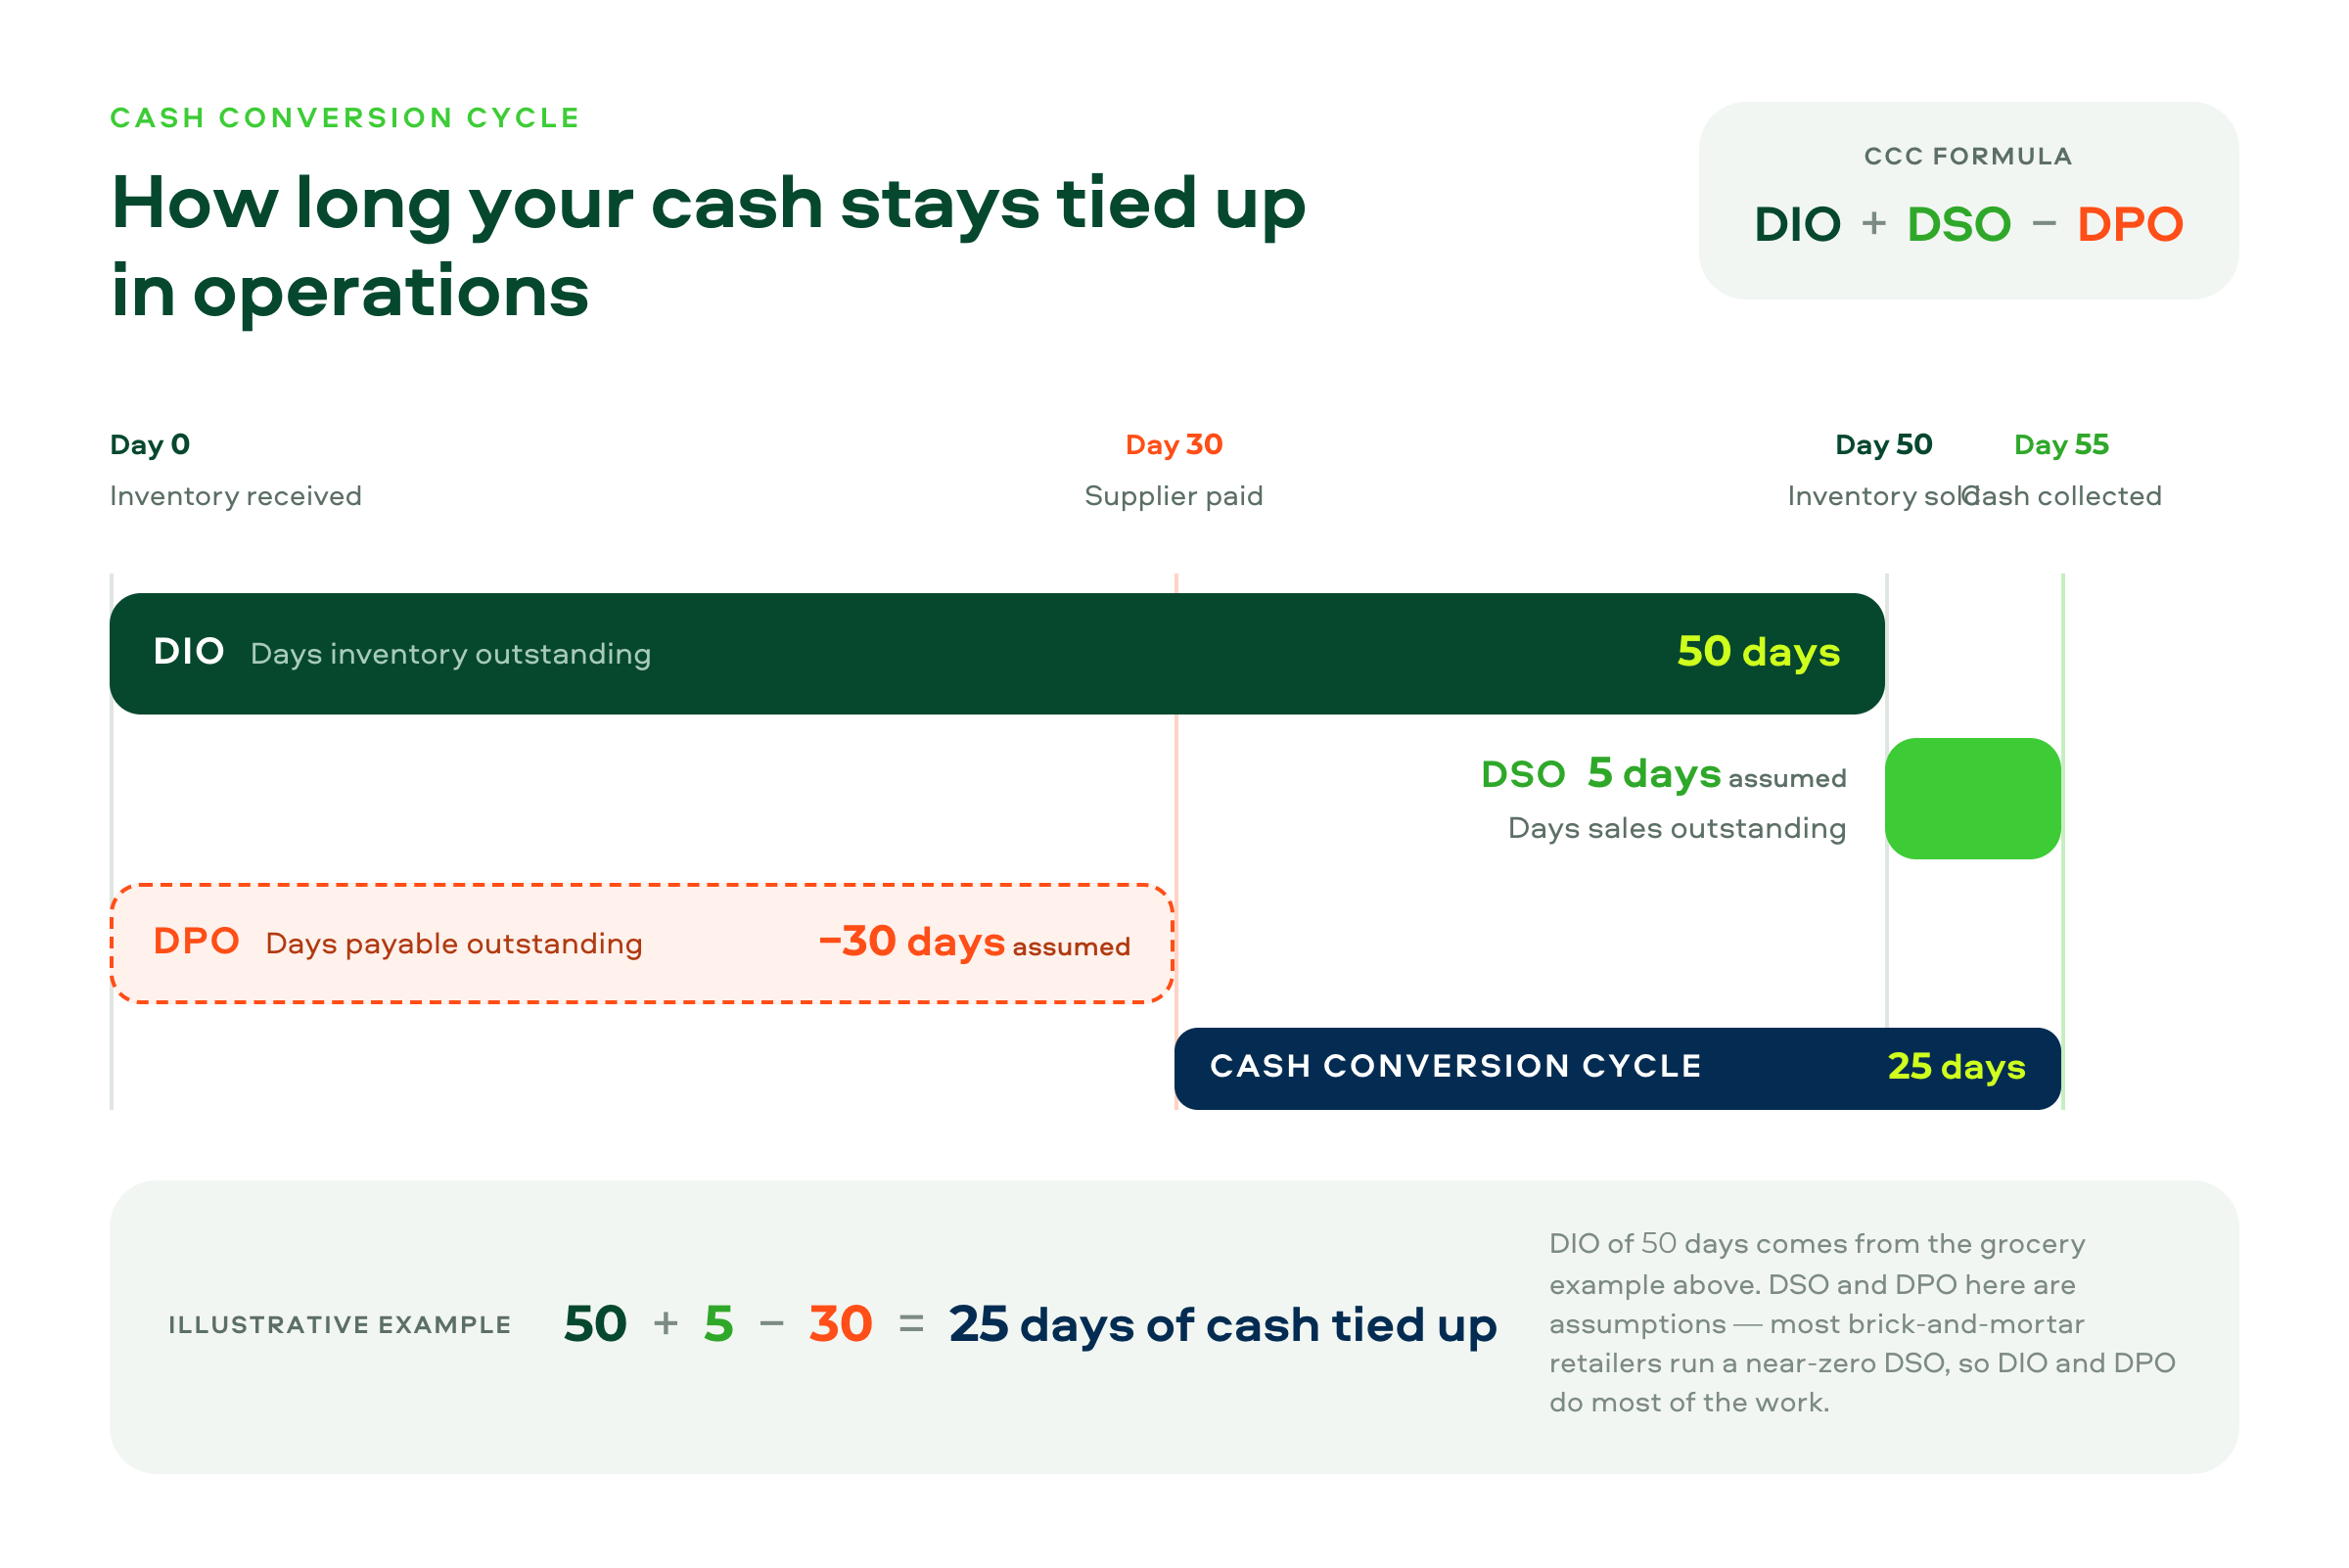
DSO (days sales outstanding) measures how long it takes to collect from customers after a sale. DPO (days payable outstanding) measures how long you take to pay suppliers. Most brick-and-mortar retailers run a near-zero DSO, since customers pay at checkout, which means DIO and DPO do most of the work in determining CCC. That's exactly why a retail-specific approach to DIO, rather than a generic FP&A one, matters so much here. It's the lever with the most room to move, and improving it is a clear signal of supply chain efficiency.
How DIO Affects Working Capital and Free Cash Flow
Every day of DIO reduction releases cash that was previously sitting on shelves as unsold stock. That cash can fund store openings, pay down short-term debt, or reduce reliance on supplier credit. On the flip side, a rising DIO quietly erodes free cash flow even when sales look healthy on the income statement. More of that revenue is represented by inventory sitting in the store rather than money in the bank.
Companies aren't managing this gap especially well right now. KPMG's research found that DIO, among the companies it tracked, rose from 42 to 47 days between 2022 and 2024. Supply chain volatility was cited as the main driver. Many retailers are carrying more inventory risk than two years ago, probably without fully realizing it. That risk shows up directly in free cash flow (FCF).
DIO vs. Inventory Turnover Ratio: What's the Difference?
DIO and inventory turnover ratio measure the same underlying reality from two different angles. Inventory turnover tells you how many times you sell through your entire stock in a year. DIO tells you how many days, on average, a unit sits before that happens. They're mathematically linked (DIO = 365 ÷ turnover), so improving one always improves the other. The practical difference is communication. Turnover ratio reads better in a boardroom comparison against competitors' annual filings. DIO is easier to act on operationally. "Cut five days off DIO" translates into a concrete reorder-point adjustment in a way "add 0.8 to our turnover ratio" doesn't, which matters for day-to-day operational efficiency.
How to Improve Days Inventory Outstanding
Reducing DIO isn't about slashing stock levels across the board. That just trades one problem, excess inventory, for another, stockouts. The retailers that improve DIO sustainably do it category by category.
Sharpen Demand Forecasting at the SKU-Store Level
Most DIO bloat traces back to a forecast that's too coarse: one number for a category, applied uniformly across stores with different traffic patterns. Demand forecasting for new products is a common blind spot, since there's no sales history to lean on. Buyers tend to over-order defensively, just in case. Gartner projects that 70% of large organizations will use AI-based forecasting to predict demand by 2030, well up from current levels. SKU-store models are a big part of why: they catch local variation that a single blanket forecast misses.
Automate Replenishment Instead of Managing It by Spreadsheet
Manual, decentralized ordering is one of the most reliable ways to end up with overstock in some locations and lost sales in others, at the same time. Moving to automated inventory replenishment removes the guesswork, and the human habit of over-ordering "just in case," from routine reordering. Stock levels then track actual demand rather than whoever placed the last order.
Run ABC(D) Analysis and Act on the Slow-Moving Tiers
Not every SKU deserves the same attention. Segment the assortment by contribution to sales and margin, then apply tighter reorder rules to the slowest-moving tiers. That's usually where the fastest DIO wins show up. Clearing genuine dead stock has an outsized effect on the average, since a handful of SKUs sitting for 200-plus days can drag an entire category's number up.
Build Promotion and Seasonality Into the Ordering Logic
A promotion calendar that isn't fed into replenishment is a near-guaranteed source of trouble: overstock from leftover promotional units, or stockouts from underestimated lift. This describes most grocery and liquor retail. Those retailers need ordering logic that accounts for planned promotional volume, rather than treating every week as a normal one.
Tighten Supplier Lead Times and Order Frequency
Longer, less frequent orders from suppliers force higher safety stock to cover the gap between deliveries. Moving to smaller, more frequent replenishment cycles, where supplier relationships allow it, is the retail equivalent of a just-in-time (JIT) approach without depending on a single supplier. It reduces both the buffer stock needed at each location and the carrying costs that come with it. That shows up directly in a lower DIO.
How LEAFIO AI Helps Reduce DIO in Practice
The retailers that move DIO in the right direction generally combine two things. First, forecasting that's accurate at the SKU-store level. Second, replenishment that acts on that forecast automatically, rather than waiting for a planner to review it by hand.
White&Dry, a European liquor store chain with 194 locations and over 2,000 active SKUs, faced exactly the imbalance described above. Decentralized manual ordering produced overstock in some stores and lost sales in others. After implementing LEAFIO Inventory Optimization, inventory turnover improved by 36%, cutting DIO from 87 to 64 days, alongside a 56% increase in sales.
Maxibuild, a DIY and building materials retailer, ran into the seasonal-demand and long-tail-SKU problems common to that category. After adopting LEAFIO's automated replenishment and analytics, average daily inventory turnover improved by 42% (DIO dropped from 43 to 25 days). Warehouse overstock fell by 39%, and lost sales dropped by 78%.
Both results trace back to the same mechanism: replacing manual, store-by-store guesswork with AI demand planning software that responds to actual sales patterns rather than static reorder points. Pair that with an inventory management software layer that turns those forecasts into orders automatically, and the pattern repeats across very different retail categories. If your team is still adjusting safety stock by feel or fighting the same overstock-in-one-store, stockout-in-another pattern every month, LEAFIO's replenishment software is built for exactly that gap.
FAQ
Retail teams asking about DIO tend to circle back to the same handful of questions. Here are direct answers to each.
What does days inventory outstanding measure?
DIO measures the average number of days a company holds inventory before selling it through. It's calculated as average inventory divided by cost of goods sold, multiplied by the number of days in the period being measured, usually 365 for an annual figure.
How do you calculate DIO using COGS?
Divide average inventory by cost of goods sold for the same period. Then multiply by the number of days in that period: (Average Inventory ÷ Annual COGS) × 365. Using COGS rather than sales revenue keeps the formula consistent, since inventory is carried at cost, not at retail price.
What is a good DIO for retail?
There's no universal number. Grocery and perishables often run 10 to 20 days. General merchandise and apparel commonly land in the 30 to 60 day range, and DIY or big-ticket categories can run higher. The more useful comparison is your own DIO trend against your category's typical range, not an absolute target.
How does DIO affect cash flow and working capital?
Every day of inventory sitting unsold represents cash that isn't available for anything else: paying suppliers, opening new locations, or covering short-term debt. A rising DIO quietly ties up more working capital even when sales figures look stable. That's why finance teams track it alongside days sales outstanding and days payable outstanding as part of the cash conversion cycle.
What's the difference between DIO and inventory turnover ratio?
They measure the same thing from opposite directions. Turnover ratio counts how many times you sell through your stock in a year. DIO counts how many days that takes on average. They're related by a simple formula, DIO = 365 ÷ turnover, so improving one automatically improves the other.
Can you reduce DIO without risking stockouts?
Yes, but it takes SKU-level precision rather than an across-the-board inventory cut. Retailers that lower DIO sustainably do it by tightening forecasts and reorder logic on genuinely slow-moving SKUs, while protecting service levels on fast-movers and promotional items.
Is a DIO of zero possible or desirable?
Practically, no. A DIO near zero would mean inventory sells the moment it arrives, which isn't realistic for any physical retail model. It would more likely signal chronic stockouts than efficiency. The goal isn't the lowest possible DIO. It's the lowest DIO that doesn't compromise product availability.


Have a question?

Jack Larson
Retail Optimization Expert


