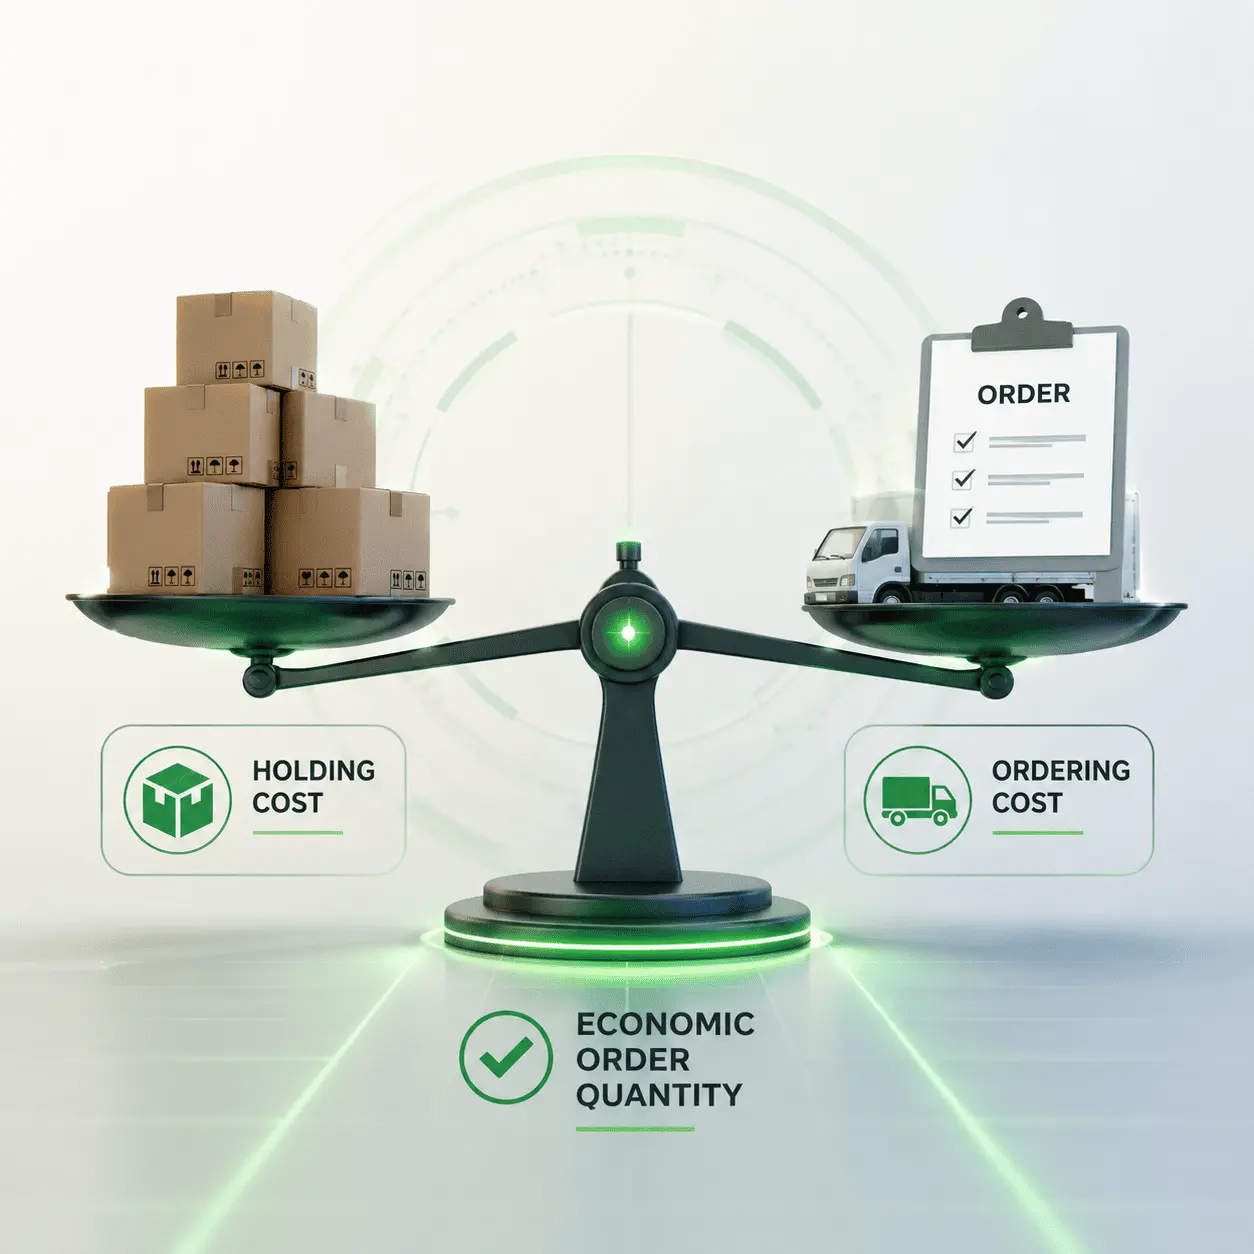


A grocery chain that reorders paper towels every three days is paying for that habit twice: once in staff time and once in freight. A DIY retailer that orders six months of the same paint at once pays for it in warehouse space and end-of-season markdowns. Economic order quantity, or EOQ, is the formula that sits between those two mistakes. It calculates the order size that keeps your ordering costs and your holding costs as low as possible. That's true for one SKU, at one supplier, at one point in time.
For a category manager juggling thousands of SKUs, EOQ isn't an academic exercise. It's the starting assumption behind almost every automated replenishment rule a modern inventory system runs. Nobody on the team may have typed the formula into a spreadsheet in years, but it's still there.
What Is Economic Order Quantity (EOQ)?
Economic order quantity is the order size that minimizes the combined cost of placing orders and holding inventory for a given product. It's one of the oldest tools in supply chain management and one of the few formulas that still earns its place on a modern planner's dashboard. Ford W. Harris introduced the model in 1913 to plan production lot sizes. Retailers adopted it decades later because the underlying tradeoff never really changed. Order too often, and administrative and shipping costs eat your margin. Order too rarely, and capital sits on a shelf instead of moving, tipping straight into overstocking.
The stakes are bigger than they look on a spreadsheet. Chain Store Age, citing IHL Group research, projected global retail inventory distortion (the combined cost of stockouts and overstocks) at $1.73 trillion in 2024, with overstocks alone accounting for $554 billion. A meaningful share of that overstock figure traces back to order quantities nobody ever recalculated once the assumptions behind them changed.
So what is economic order quantity in practice? It's a single number, expressed in units, that answers one question: how many units should this SKU's next order contain? The goal is keeping total inventory cost as low as possible. That depends on how often you sell it, what an order costs, and what it costs to hold a unit for a year.
The EOQ Formula: Breaking It Down
The economic order quantity formula is:
EOQ = √(2DS / H)
Where D is annual demand in units, S is the fixed cost of placing one order, and H is the annual holding cost per unit. Run the numbers, and you get the order quantity where total ordering cost and total holding cost are equal. That's also the point where their sum is at its minimum.
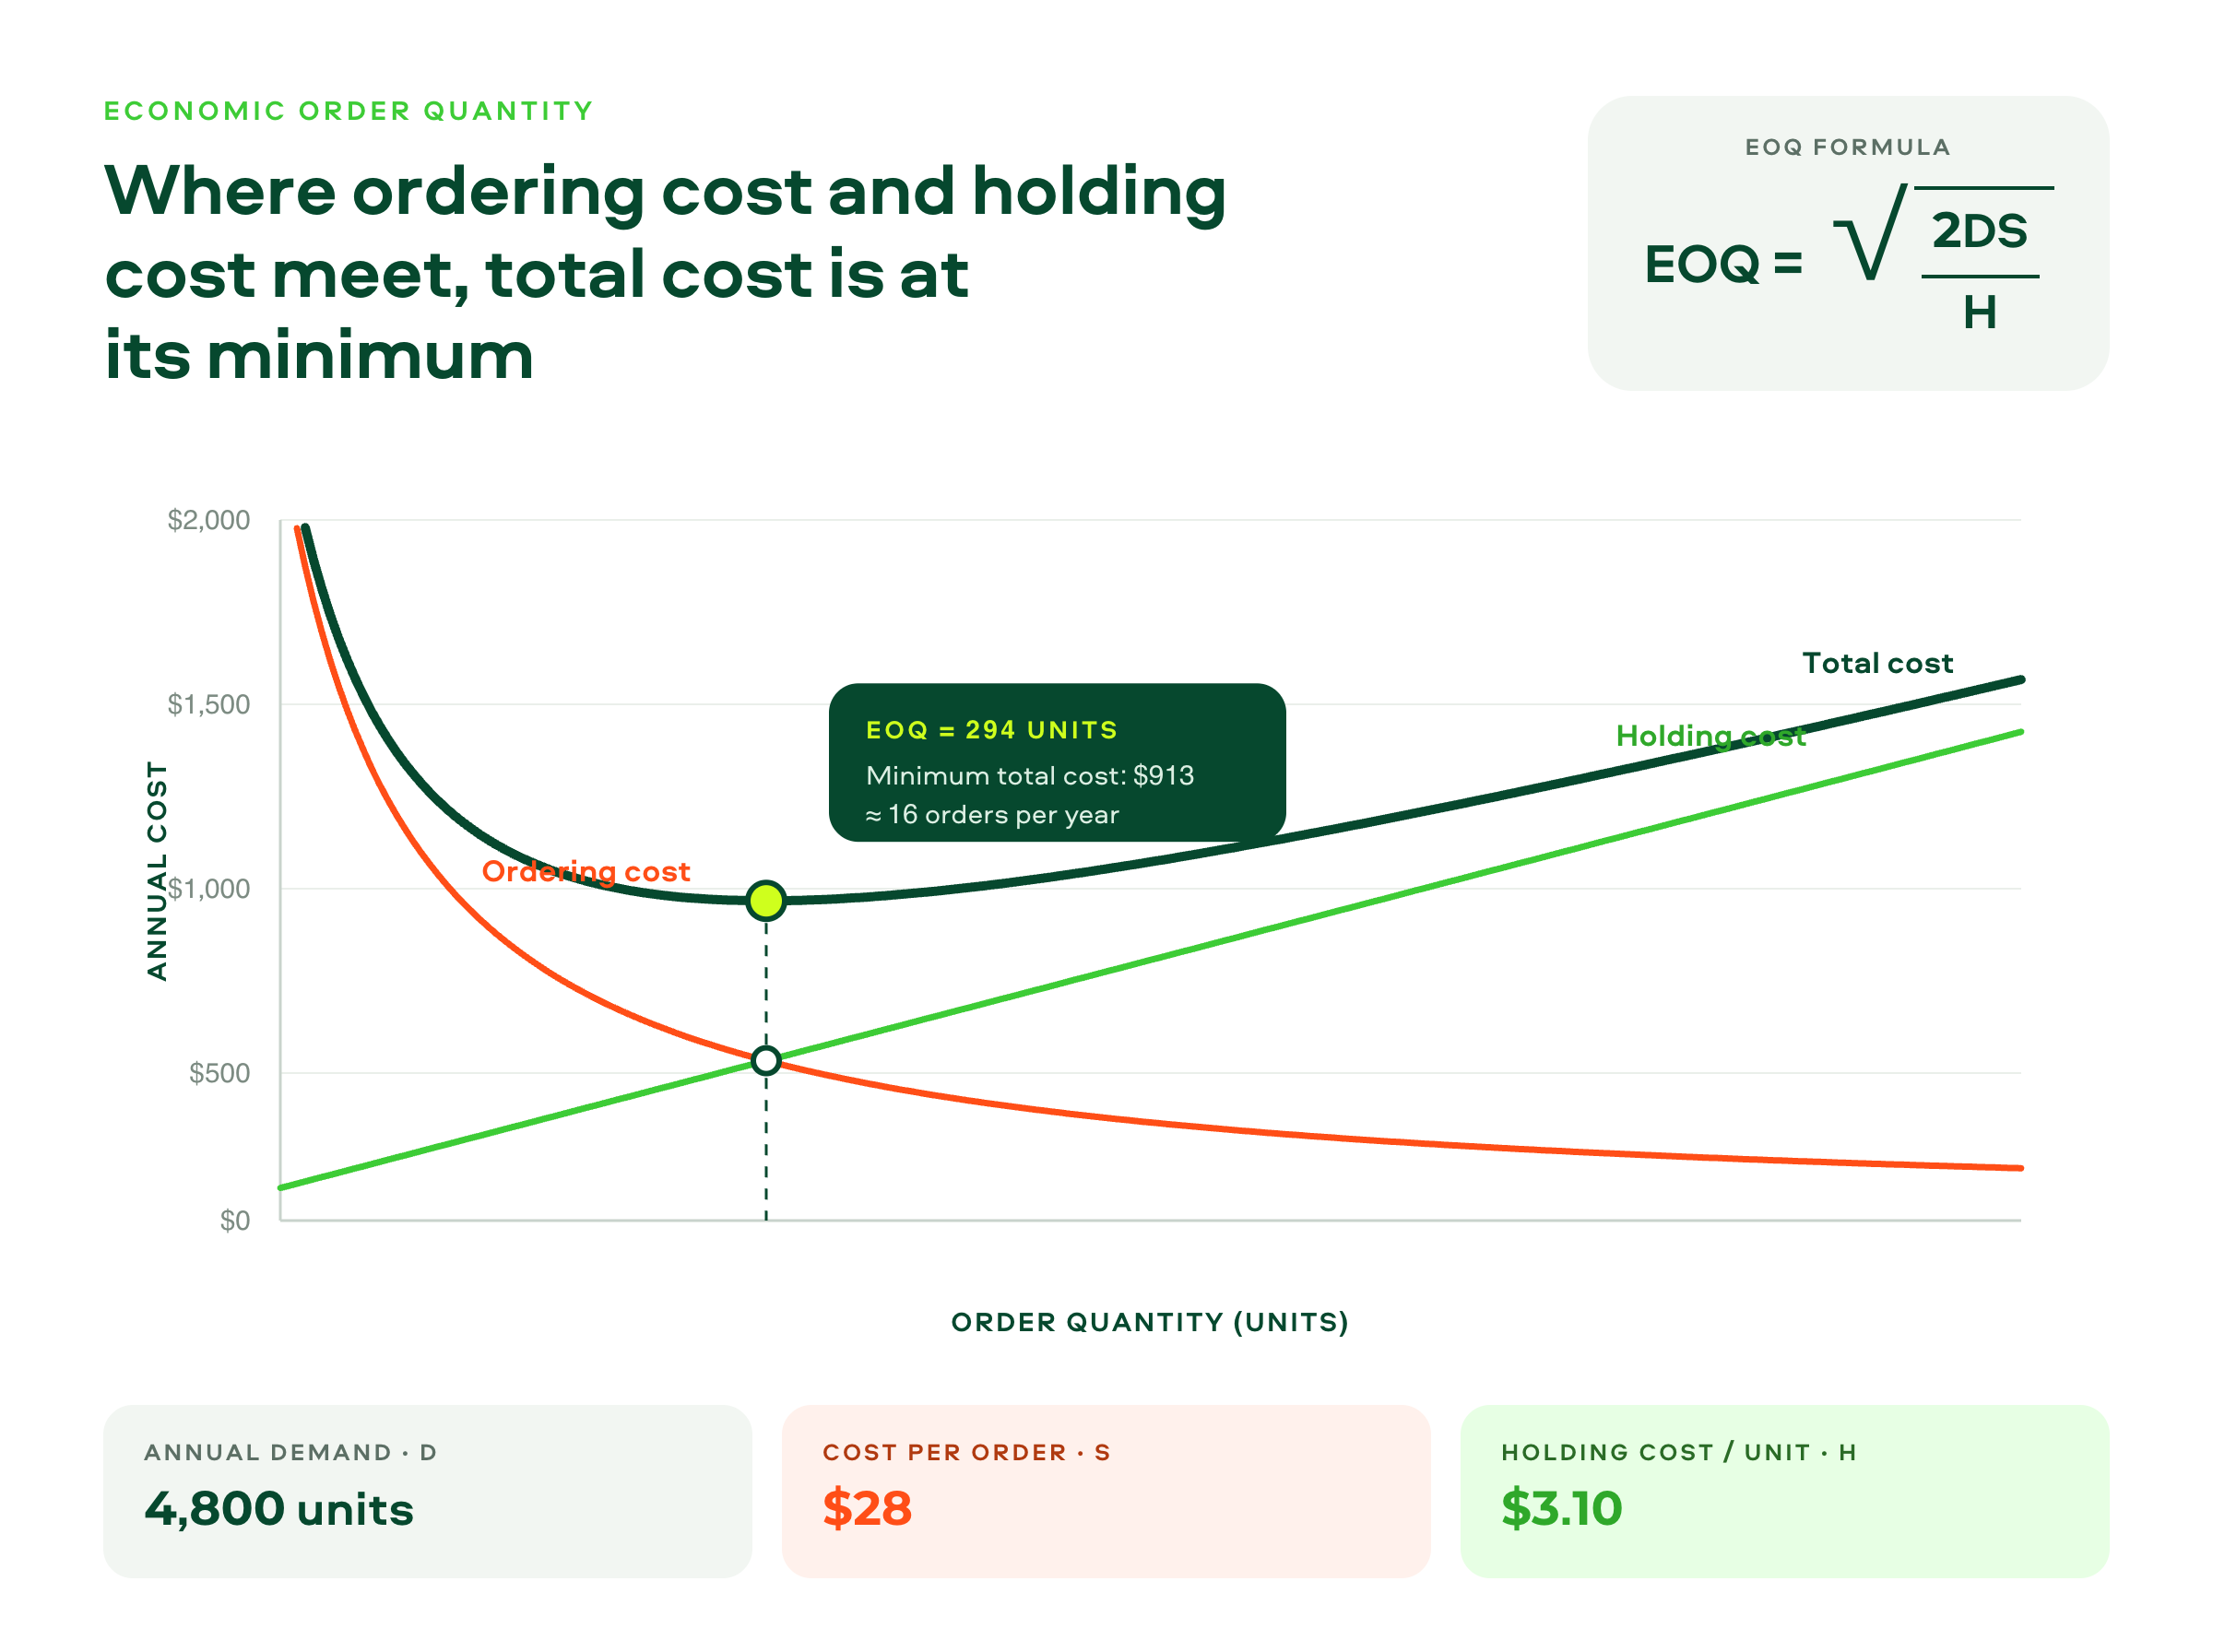
EOQ Formula Variables Explained
Annual demand (D) is how many units you expect to sell or use over the next twelve months, pulled from POS history rather than a hopeful forecast. If a store sells 4,800 units of a SKU a year, D is 4,800. Seasonal items complicate this, since EOQ works on an average and needs a separate safety stock calculation to absorb the peaks.
Ordering cost (S) covers everything tied to placing and receiving one order, regardless of size: purchase order creation, approvals, inbound freight, receiving labor, and invoice reconciliation. Retailers routinely underestimate this figure because most of it is buried in salaried staff time rather than a line item anyone tracks.
Holding cost (H) is what it costs to keep one unit in stock for a year, and it's usually the most underestimated input of the three. It includes warehouse rent, insurance, shrinkage, spoilage risk, and, often the largest piece, the opportunity cost of the capital tied up in that unit instead of somewhere else in the business. These are the same components most planners lump together as carrying costs. Most retailers land somewhere between 15% and 30% of a unit's value per year once every component is counted honestly.
| Variable | What it means | Retail example |
|---|---|---|
| D | Annual demand in units | 4,800 units per year |
| S | Cost to place one order | $28 per order |
| H | Annual holding cost per unit | $3.10 per unit |
EOQ Calculation: Step-by-Step Example
Here's how to calculate EOQ using the numbers above, for a mid-size toy retailer restocking a popular board game.
- Estimate annual demand from POS history: D = 4,800 units.
- Calculate the fixed cost of one order: S = $28 (PO processing, receiving, and invoice matching).
- Estimate annual holding cost per unit: H = $3.10 (storage, insurance, and capital cost combined).
- Plug the values into the EOQ formula: EOQ = √((2 × 4,800 × 28) / 3.10).
- Work through the math: √(268,800 / 3.10) = √86,709 ≈ 294 units.
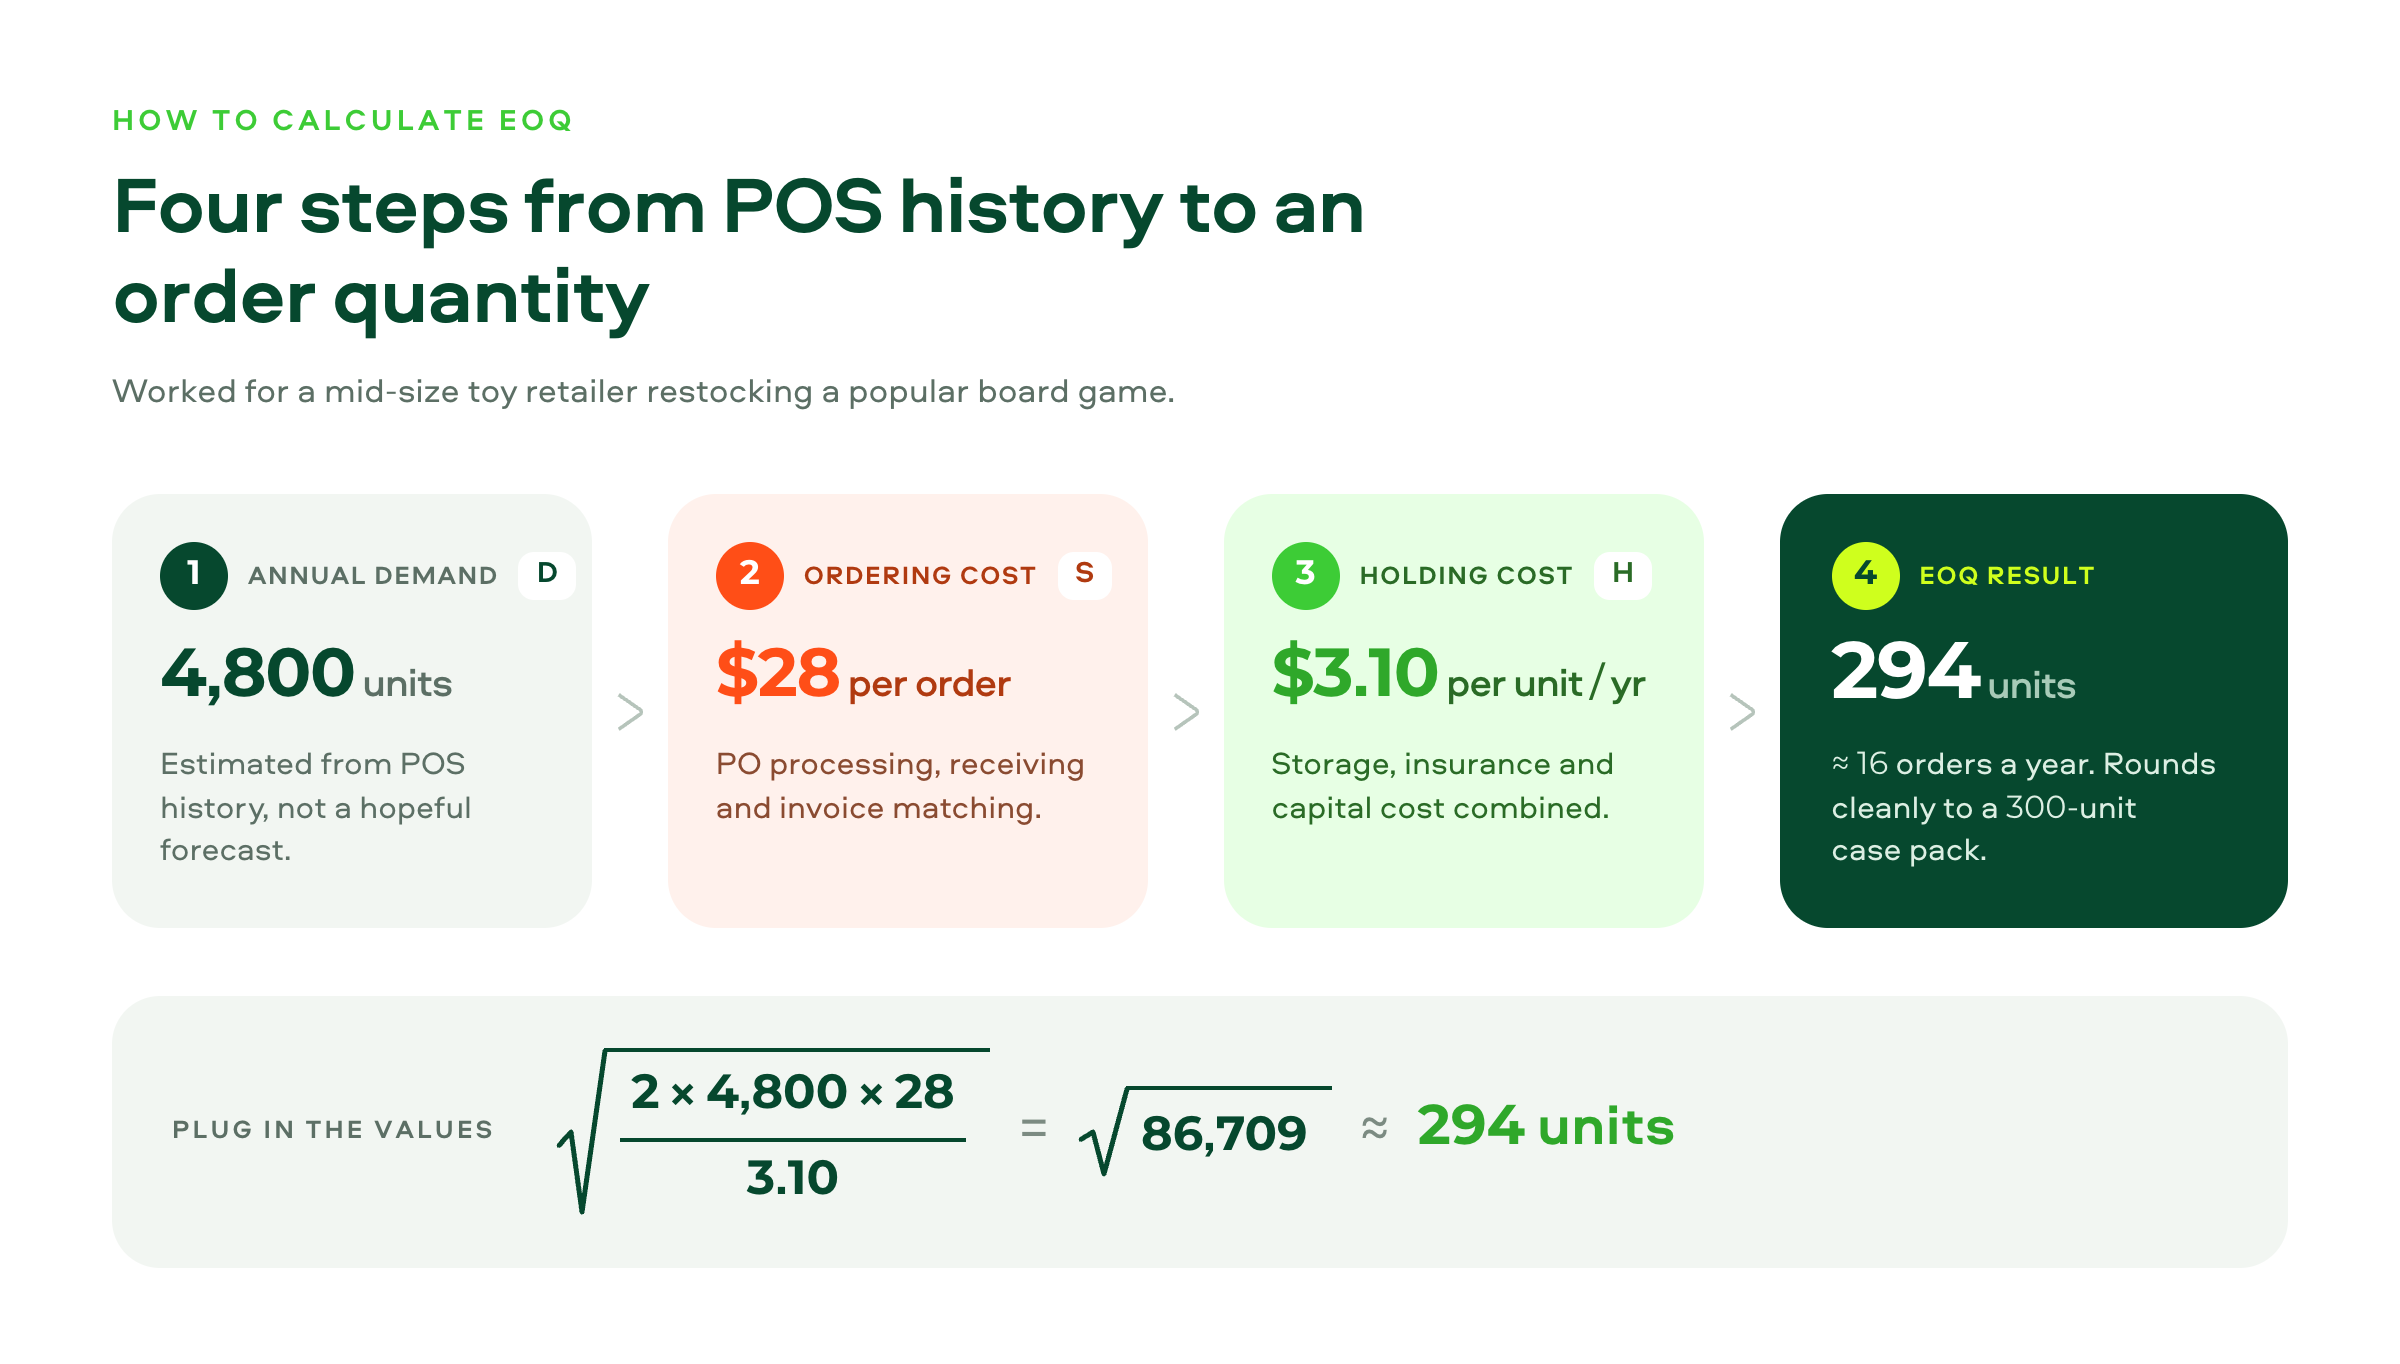
The optimal order quantity for this SKU is roughly 294 units per order. That works out to about 16 orders a year, rather than a monthly guess or a single bulk buy. Round to a workable case pack (say, 300 units), and the total cost barely moves. EOQ is famously insensitive to small rounding near its own minimum. This EOQ example is deliberately simple. The same math scales to a full assortment once EOQ inventory management becomes a standing process, not a one-off spreadsheet exercise.
This is exactly the kind of decision that shows up at scale in real retail operations. Toy House, a 67-store toy retailer running more than 50,000 SKUs, moved from Excel-based order guessing to a systematic, algorithm-driven ordering approach. After adopting LEAFIO AI's inventory optimization software, the chain cut overstock by 19% and grew like-for-like sales by 10%. SKU availability reached 98% along the way. Its replenishment cycle, which once needed five to seven planners per store cluster, now runs with just two planners for the entire network.
Key Assumptions of the EOQ Model
The EOQ formula is elegant because it simplifies. The list of EOQ assumptions is short, but each one matters:
- Demand is constant and known. The model assumes you know D with certainty and that it doesn't fluctuate week to week.
- Replenishment is instantaneous. Stock is assumed to arrive all at once, not gradually, and lead time doesn't factor into the quantity itself.
- Ordering and holding costs are fixed. S and H are treated as stable regardless of how large or small an individual order is.
- There's no quantity discount. The classic formula assumes the unit price doesn't change no matter how many units you buy at once.
- Each SKU is ordered independently. The formula doesn't account for combining multiple SKUs into a single shipment or truck.
None of these assumptions is true in a real store, which is exactly why the next two sections matter more than the formula itself.
Benefits of Using Economic Order Quantity
Even with its simplifications, the economic order quantity benefits are real once you apply the number as a baseline rather than a rulebook.
Lower Combined Inventory Costs
EOQ finds the point where ordering costs and holding costs offset each other, so you stop overpaying on either side. A retailer ordering by gut feel is almost always doing one of two things. Either they're placing too many small orders, which inflates S, or sitting on too much stock, which inflates H. EOQ gives you a number to check your instincts against.
Freed-Up Working Capital
Every unit sitting on a shelf is cash your business can't use elsewhere. Right-sizing order quantities keeps less capital parked in slow-turning stock, which matters more the tighter your margins are. This is the mechanism behind most of the sales and turnover gains retailers report after adopting systematic ordering.
Take OMA, a 38-store DIY hypermarket chain carrying roughly 70,000 SKUs. Before implementing LEAFIO AI, orders were formed semi-manually against a 60-day minimum stock rule that ignored real demand signals. After rolling out algorithm-driven ordering, OMA reduced stock levels by 15% and cut overstock by 10% on its pilot product groups within twelve weeks. Inventory turnover then improved by 18%, and sales grew 32% over the following two years.
Fewer Emergency Orders and Steadier Supplier Relationships
Ordering in economically sized, predictable batches means fewer panicked rush orders and fewer expedited-freight surcharges. Suppliers notice consistent order patterns too, and predictability on your side often translates into better terms or priority during tight supply periods on theirs.
Limitations of the EOQ Model
This is where most vendor blog posts get vague, and it's also where retail differs most from the manufacturing floor EOQ was built for. The EOQ limitations aren't small print. They're the reason nobody should run a retail replenishment program on the raw formula alone.
Demand Is Rarely Constant on a Retail Shelf
Promotions, weather, local events, and plain seasonality mean D swings hard, sometimes week to week. A paint retailer's demand for exterior paint in April looks nothing like its demand in November. Run EOQ on an annual average, and you'll under-order during a promotion and over-order right after one ends.
Minimum Order Quantities and Discounts Distort the "Optimal" Number
Suppliers often set a minimum order quantity with no relation to your calculated EOQ. Volume discounts can also make a larger order cheaper overall, even off the textbook optimum. In practice, EOQ becomes a benchmark you compare a supplier's constraints against, not a number you get to order exactly.
SKUs Don't Ship Alone
The formula treats each product as if it travels on its own truck. Real retail logistics run in pallets, case packs, and full loads shared across dozens of SKUs headed to the same store or distribution center. Optimizing one item's EOQ in isolation can leave you a few units short of a full pallet layer, which quietly erases the savings the formula promised.
EOQ vs. Safety Stock: How They Work Together
EOQ and safety stock answer two different questions. Mixing them up is one of the more common planning mistakes we see. EOQ answers "how many units should I order at once?" It says nothing about when to order or how much buffer to keep against a bad week.
That's where reorder point calculations and safety stock come in. The reorder point tells you the inventory level that triggers a new purchase order, accounting for lead time and expected demand during that lead time. Safety stock is the extra cushion layered on top to absorb demand spikes or a late delivery without running out.
Think of it this way: EOQ sizes the order, the reorder point times it, and safety stock protects it from surprises. A retailer using EOQ without a reorder point is choosing the right batch size and then guessing at when to press the button. That defeats most of the point.
Beyond EOQ: How AI-Powered Tools Modernize Inventory Optimization
The formula was built for a world with one supplier, one price, and demand that barely moved. Retail in 2026 is none of those things, and that gap is exactly what AI-driven replenishment platforms are built to close.
According to McKinsey, embedding AI in planning and inventory can reduce inventory levels by 20 to 30 percent. It does this by improving demand forecasting through dynamic segmentation and machine learning, rather than a single static average. Instead of recalculating D once a quarter, an algorithm can re-estimate demand daily, per SKU and per store. It can then adjust the effective order quantity as promotions start and end. Deloitte's research points the same way: 30% of retailers surveyed already use AI for supply chain visibility, and that figure is expected to climb to 41% within a year. Dynamic, algorithm-driven ordering is quickly becoming the default rather than the exception.
Al.Capone, a 120-store liquor retail chain in Poland carrying more than 2,500 SKUs, is a useful example of what this looks like on the ground. The chain replaced manager-driven, subjective ordering with a centralized system. It factors in average daily usage, current inventory position, and goods already in transit, then generates a ready-to-send order for every SKU continuously, not once a quarter. In its pilot rollout, Al.Capone achieved 46% faster inventory turnover and a 5.2% sales increase. The system also surfaced suppliers whose minimum order requirements were quietly inflating costs across the assortment.
This isn't a replacement for understanding EOQ. It's what EOQ looks like once you stop recalculating it by hand. LEAFIO AI's inventory optimization software and automated replenishment tools apply the same cost-balancing logic. The difference is they recompute it continuously against live sales, lead times, and supplier constraints, instead of a quarterly spreadsheet—flagging exceptions for a planner to review rather than replacing the judgment call itself. If your team is still running EOQ once a season and hoping it holds, that's usually the first sign it's time to see what a demo looks like.
FAQ
A few questions come up often once a team starts applying EOQ to real assortments instead of a single textbook example.
What is economic order quantity and how is it calculated?
Economic order quantity is the order size that minimizes the combined cost of ordering and holding inventory for a specific product. It's calculated with the formula EOQ = √(2DS/H), where D is annual demand, S is the cost per order, and H is the annual holding cost per unit.
What's the EOQ formula with an example, step by step?
Walking through the EOQ formula with an example step by step: using D = 4,800 units, S = $28, and H = $3.10, EOQ = √((2 × 4,800 × 28) / 3.10) = √86,709 ≈ 294 units. That means ordering roughly 294 units at a time minimizes the retailer's combined ordering and holding costs for that SKU.
What are the benefits of using economic order quantity?
EOQ lowers combined inventory costs, frees up working capital that would otherwise sit in excess stock, and reduces the frequency of rushed, expensive emergency orders. It also gives planners an objective number to check gut-feel ordering decisions against.
What are the assumptions of the EOQ model?
The model assumes constant, known demand, instant replenishment, and stable ordering and holding costs. It also assumes no quantity discounts and that each SKU is ordered independently of every other product. Retail rarely meets any of these conditions fully.
What is the difference between EOQ and safety stock?
EOQ determines how many units to order at once. Safety stock is a separate buffer, layered on top of the reorder point, that protects against demand spikes or late deliveries. The two work together rather than substitute for each other.
When should you use the EOQ model?
EOQ works best as a starting benchmark for stable, high-volume SKUs with predictable demand and known, unchanging costs. For promotional, seasonal, or highly volatile items, it needs to be paired with dynamic demand forecasting rather than applied as a fixed, one-time calculation.
Is EOQ calculated per SKU or across an entire assortment?
EOQ is calculated per SKU, not across a whole assortment. Each product has its own demand pattern, ordering cost, and holding cost. Bundling several SKUs into one blended calculation produces a number that doesn't match any of them accurately.


Have a question?

Jack Larson
Retail Optimization Expert


