


A convenience chain running 200 stores can lose a full week of sales on a single SKU. The cause is often simple: someone set the reorder point by gut feel instead of by the numbers. Multiply that across a few thousand SKUs, and the math turns ugly fast. According to IHL Group, worldwide inventory distortion (the combined cost of stockouts and overstocks) reached 1.73 trillion dollars in 2025, equal to 6.5% of global retail sales. Most of that is preventable, and it starts with one number: the reorder point.
For retailers specifically, the reorder point is rarely the tidy, static figure you see in manufacturing textbooks. A promotion calendar can double demand for a week. A perishable category can turn safety stock into a loss if it sits too long. A planogram change can shift how many facings a store even has room for. This guide covers the standard formula, but it also covers what changes when your assortment lives on a retail shelf instead of a factory floor.
What is a Reorder Point (ROP)?
The reorder point is the inventory level at which you place a new order so stock arrives before you run out. It's a trigger, not a target. Once your stock on hand (plus anything already on order) drops to this level, the system, or the person watching the dashboard, should fire off a purchase order.
In plain terms, a reorder point in inventory management answers one question: how low can this SKU's stock go before you're gambling with a stockout? Get it right and replenishment becomes routine. Get it wrong and you're either firefighting empty shelves or writing off dead stock.
The reorder point is calculated separately for every SKU at every location. That's exactly why manual, spreadsheet-based reorder point planning falls apart once an assortment grows past a few hundred items. An inventory reorder point isn't a static number set once and forgotten either; it should move as demand, lead time, and season move.
Why is a reorder point important?
A reorder point that's off by even a few days of stock can ripple through a whole store. Run it too low, and shelves go bare during exactly the periods when customers are most likely to buy (weekends, paydays, promotions). Run it too high and you're paying to store, insure, and eventually mark down goods nobody wants yet.
Retail adds a layer that generic ROP guides tend to skip: demand isn't smooth. A single promotion can spike daily sales five or ten times over baseline. If your reorder point is built purely on trailing averages, it will not see that spike coming. According to McKinsey's 2024 Global Supply Chain Leader Survey, the share of companies leaning on bigger inventory buffers to manage disruption fell to 34%, down from 59% just a year earlier. More supply chain teams are shifting toward precise, demand-based buffers instead of blanket overstocking. That shift matters even more for retailers juggling promotions, seasonality, and perishables at the same time.
Reorder Point Formula
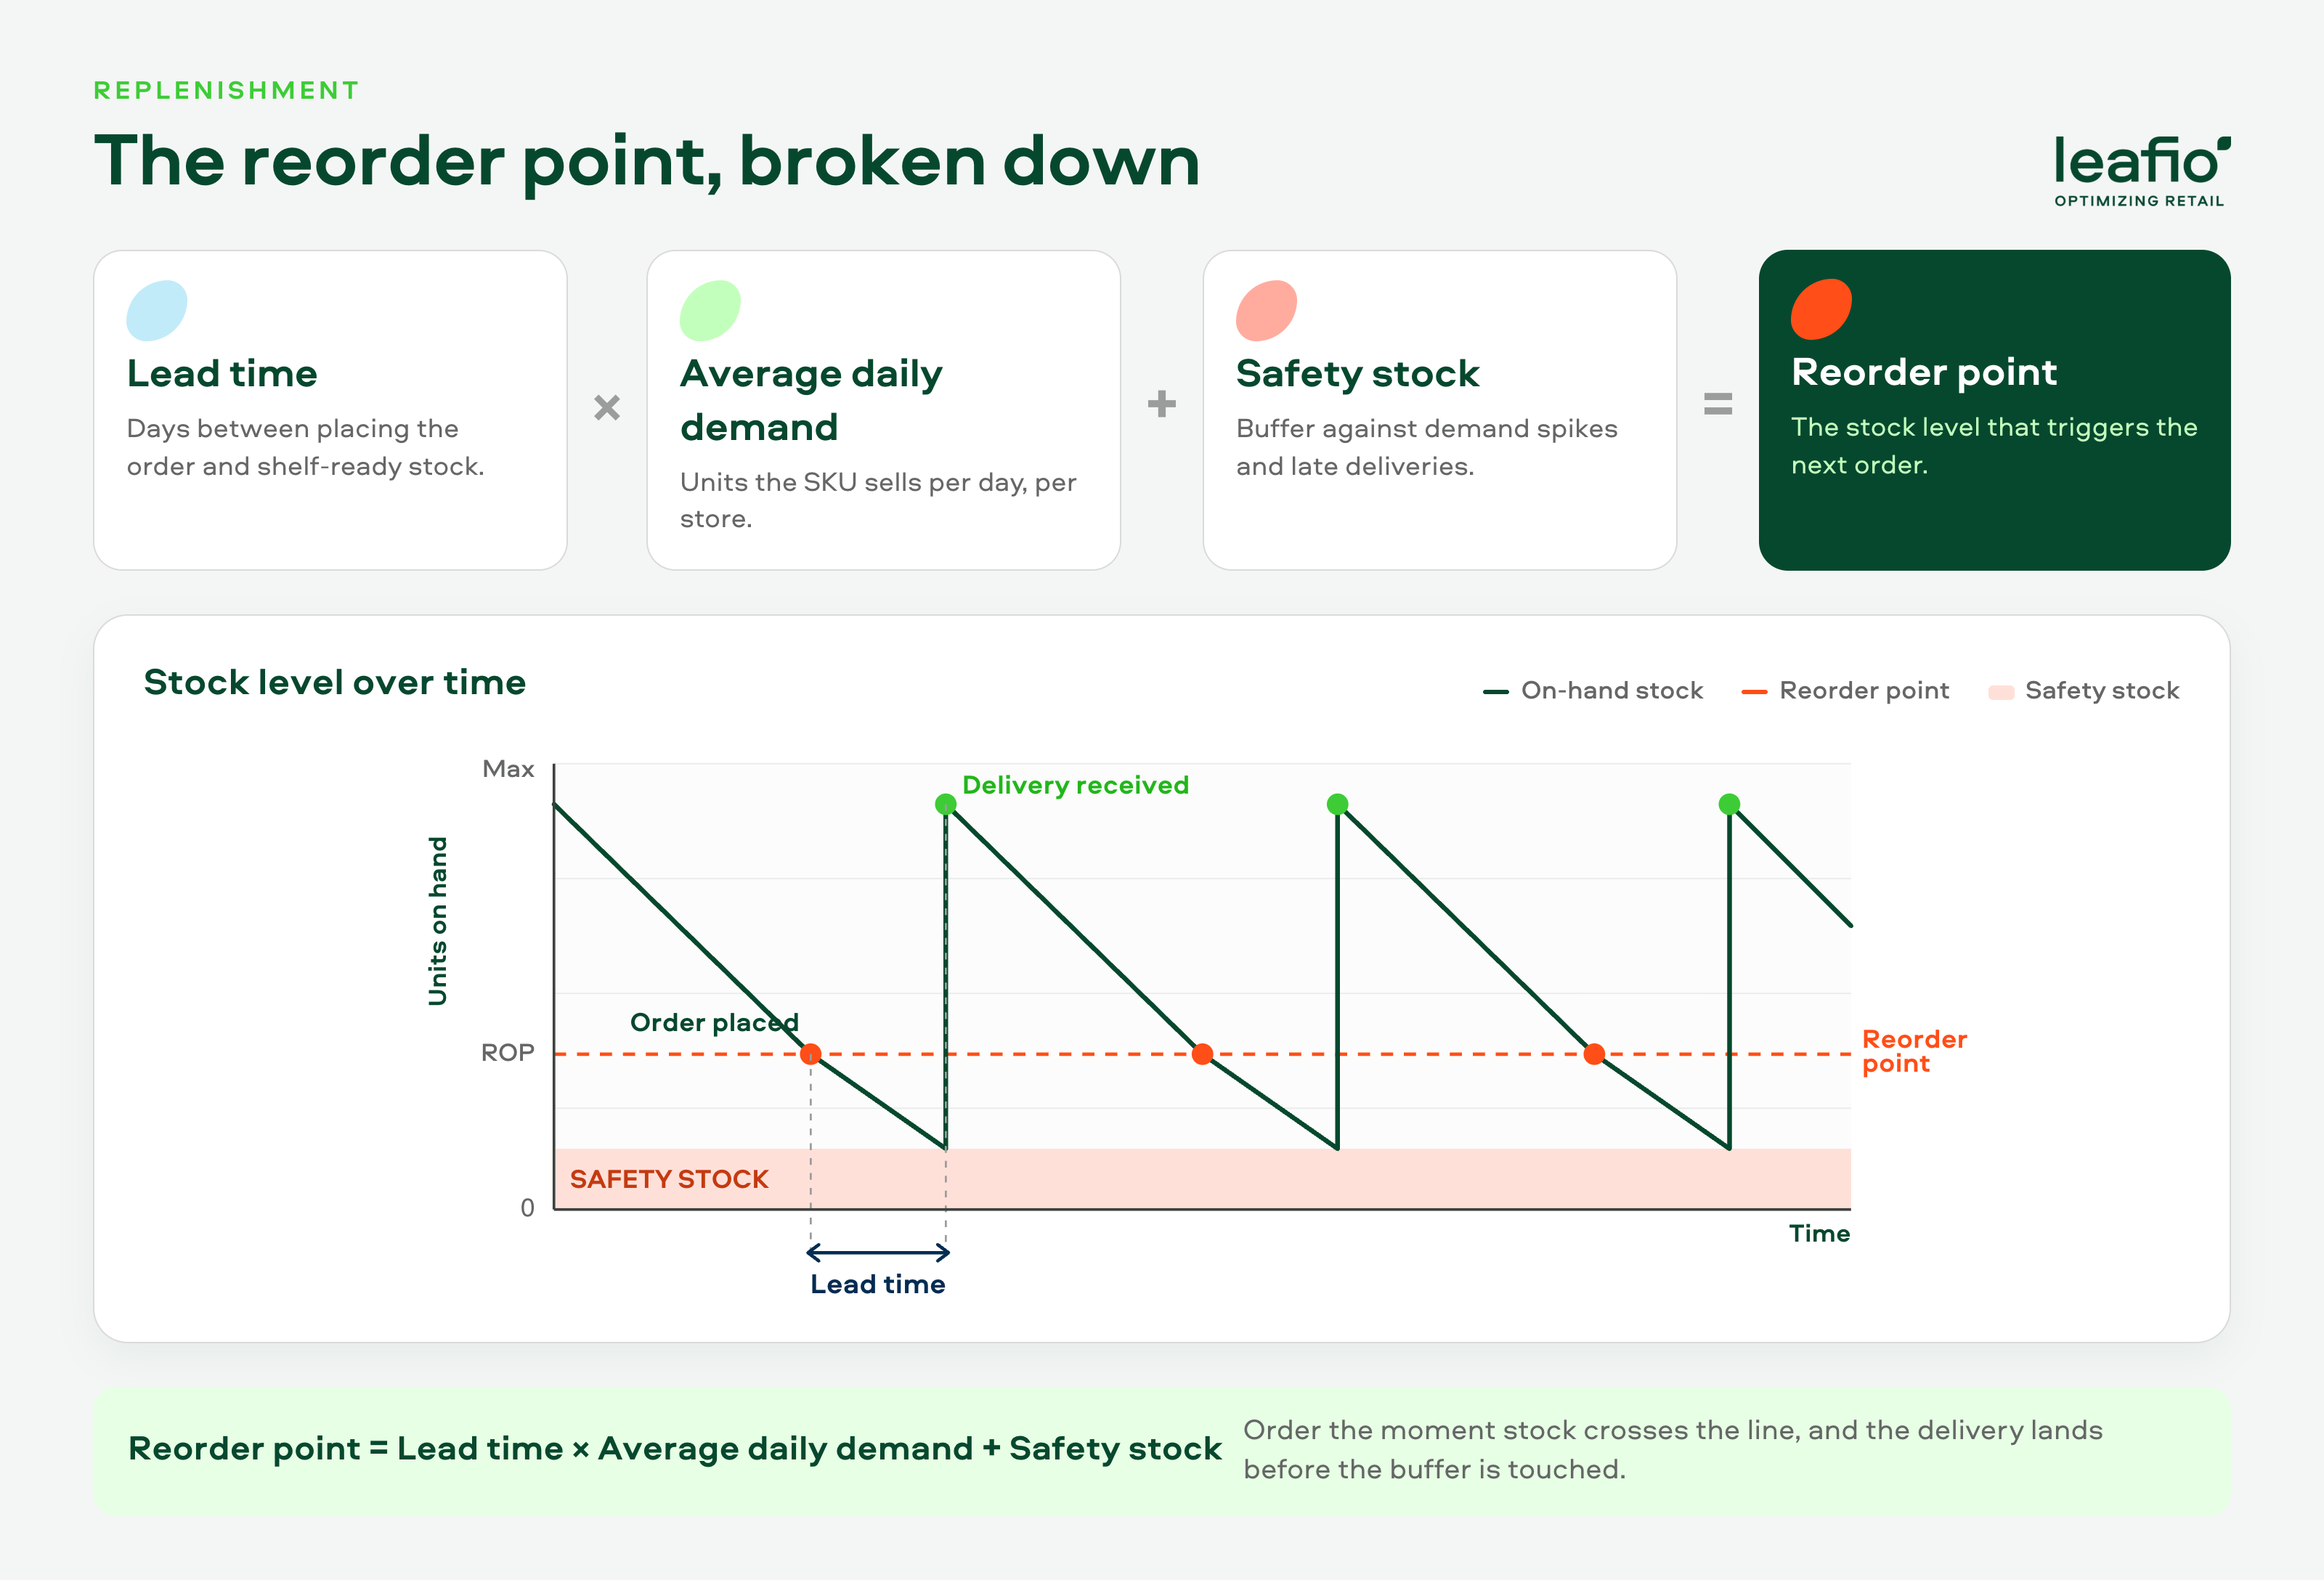
The classic reorder point formula is:
Reorder Point = (Lead Time × Average Daily Demand) + Safety Stock
Three inputs drive the whole calculation. Get any one of them wrong and the reorder point is calculated against the wrong reality.
Lead Time
Lead time is the number of days between placing an order and having usable stock on the shelf, not just stock in the building. For a distribution center replenishing stores, that includes supplier delivery time, DC processing, and the truck run to the store. Lead time is rarely a fixed number either; a supplier's "5 days" can stretch to 8 during peak season or around holiday closures.
Average Daily Sales
This is your average demand per day for the SKU, ideally pulled from POS data over a representative period. Don't lean on an ERP's raw sales quantity alone. It can undercount days the item was actually out of stock. That's an easy trap: if a product was out for a week, its "average" looks artificially low right when you need it most.
Safety Stock
Safety stock is the buffer layered on top of expected demand to absorb variability in either demand or delivery. It's the difference between a reorder point that survives a late truck and one that doesn't. Safety stock should scale with how volatile a category is, not stay fixed across the whole assortment.
How to Calculate Reorder Point: Step-by-Step
Here's how to calculate the reorder point for a single SKU, step by step. If you're wondering how to compute a reorder point without specialized software, a spreadsheet works fine for a small assortment; the five steps below are the same either way.
Step 1: Pull your data
Gather lead time (in days) and a demand history long enough to smooth out noise, typically 8 to 13 weeks of POS or ERP sales data. Adjust that history for any known stockout days.
Step 2: Calculate average daily demand
Divide total units sold over the period by the number of days in that period. If an SKU sold 840 units over 28 days, average daily demand is 30 units.
Step 3: Multiply by lead time
Multiply average daily demand by the supplier's lead time in days. At 30 units a day and a 6-day lead time, that's 180 units of expected demand during the wait.
Step 4: Add safety stock
Add a buffer sized to the category's demand and lead-time variability (more on how to size this below). If safety stock for this SKU is 60 units, the reorder point comes to 240 units.
Step 5: Recheck and repeat
Reorder point planning isn't a one-time exercise. Demand shifts, suppliers change lead times, and seasons turn. Recalculating monthly, or automatically through software, keeps the number honest.
Reorder Point Calculation Examples
Example 1: Retail Business
A grocery retailer sells a private-label pasta sauce at an average of 45 units a day per store. Lead time from the supplier's DC is 4 days. Baseline safety stock, based on normal demand variability, is 50 units. That gives a reorder point of (45 × 4) + 50 = 230 units. But the category runs a promotion every six weeks that lifts daily sales to around 120 units for the promo window. If the safety stock isn't temporarily raised to cover that spike, the store will run out mid-promotion. That's exactly the kind of scenario a generic manufacturing formula doesn't account for.
Example 2: Manufacturing
A parts manufacturer uses 25 units a day of a subcomponent with a 10-day supplier lead time and stable, predictable consumption. Safety stock can sit lower here, say 40 units, because demand doesn't swing the way retail sell-through does. The reorder point comes to (25 × 10) + 40 = 290 units, calculated once and revisited only when production volumes shift.
Reorder Point vs. Safety Stock: What's the Difference?
These two terms get mixed up constantly, so it's worth being precise. Safety stock is a cushion, the extra units you hold to absorb the unexpected. The reorder point is the trigger level, the number that tells you when to act. Safety stock is one of the three inputs that produce the reorder point; the reorder point is the output. You can have a reasonable safety stock number and still get the reorder point wrong if lead time or demand data is off. Some teams use "inventory reorder level" as another name for the same trigger; whichever term your organization uses, the underlying calculation is identical.
Risks of a Poorly Defined Reorder Point
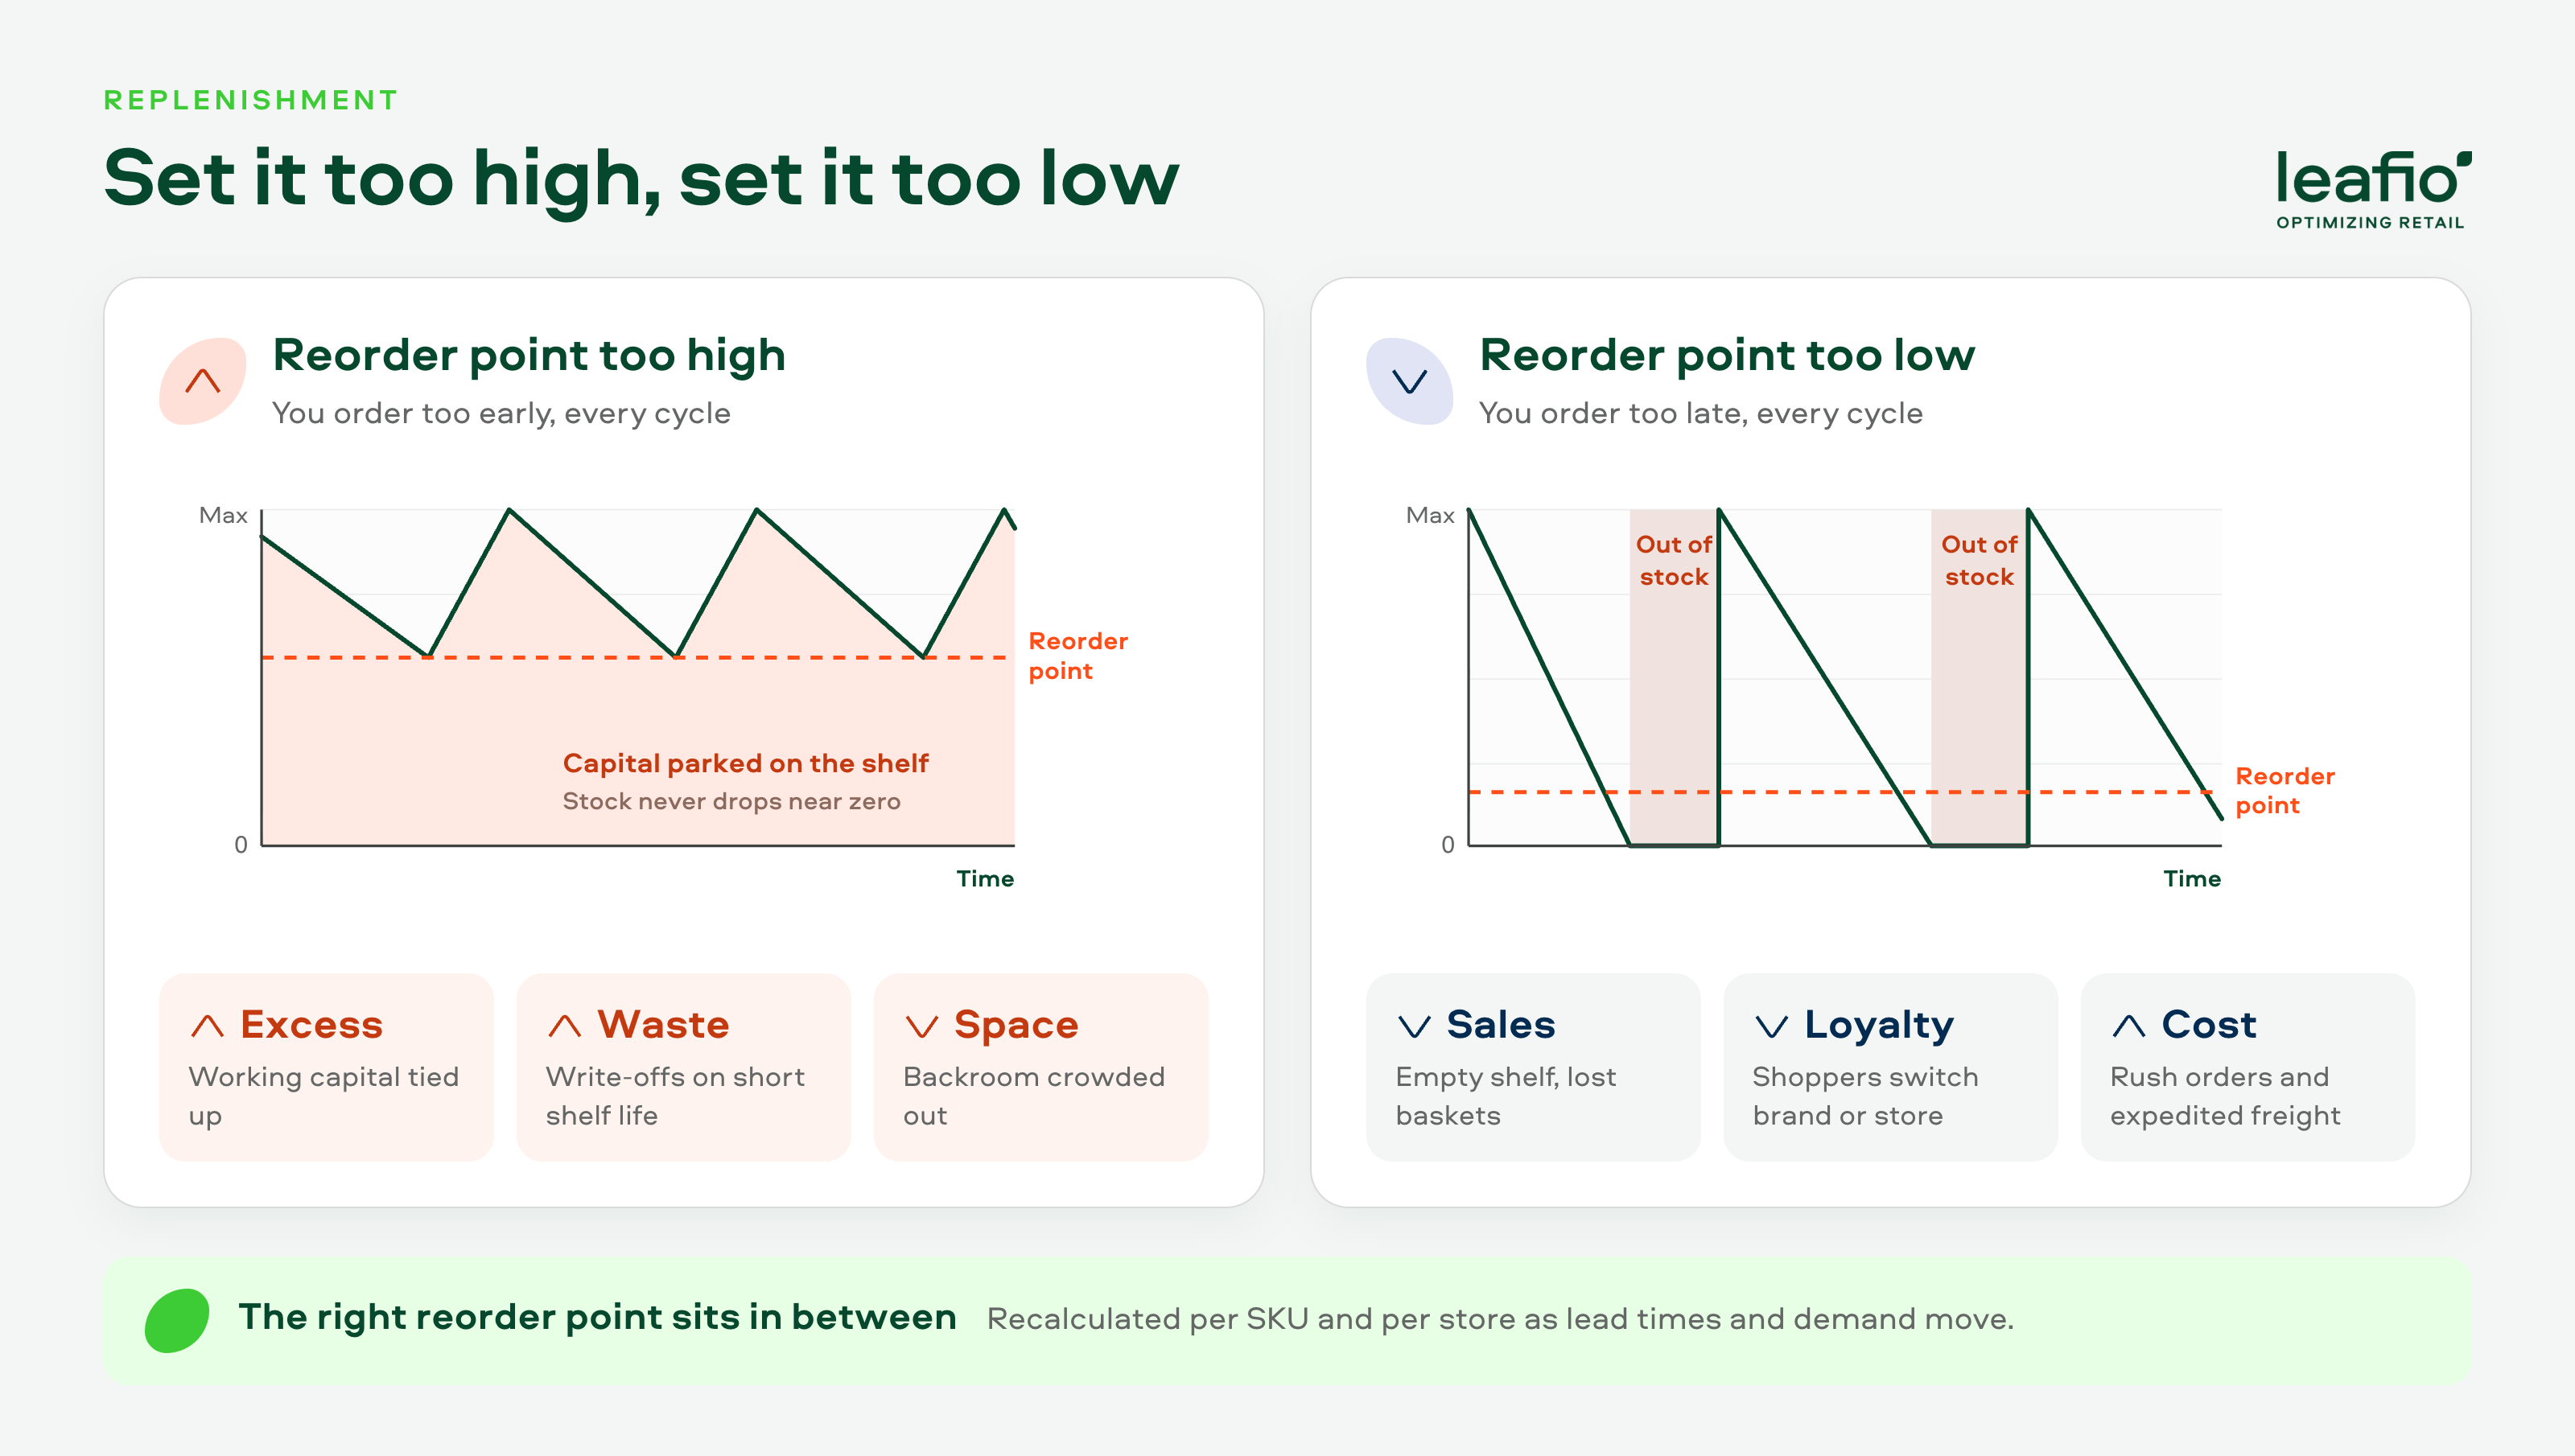
Risks of a Too-High Reorder Point
Setting the trigger too high means you're ordering earlier and more often than you need to. That ties up cash in stock sitting on shelves or in the back room, and it adds storage and handling costs. For perishables, it directly increases shrink and write-offs. In DIY and grocery formats especially, excess stock also crowds out space that could go to faster-moving products.
Risks of a Too-Low Reorder Point
Set it too low and you're rolling the dice on a stockout every single replenishment cycle. Lost sales are the obvious cost, but there's a second-order effect too. Customers who hit an empty shelf on a staple item don't always come back for it on their next trip. Repeated stockouts erode trust in the store as a reliable place to shop. Across a whole network, a systematically too-low reorder point is one of the biggest drivers behind these losses. It's exactly the kind of pattern IHL Group tracks in its inventory distortion research.
Benefits of Using Reorder Points
Done well, reorder points give a retailer a few concrete wins:
- Fewer emergency orders and rush shipping costs, because replenishment happens ahead of the shortage rather than in reaction to it.
- Lower carrying costs, since stock is sized to actual demand and lead time instead of round numbers or gut feel.
- More consistent on-shelf availability, which protects both sales and customer trust.
- A foundation for automation: once reorder points are calculated correctly, ordering can run with far less manual review.
Reorder Point and EOQ: How They Work Together
Reorder point and economic order quantity (EOQ) answer two different questions. The reorder point tells you when to order; EOQ tells you how much to order once you've decided to place that order. EOQ balances ordering costs against holding costs to land on a quantity that minimizes total cost. Used together, the reorder point triggers the order, and EOQ (or a similar sizing rule, since pure EOQ assumes fairly stable demand) determines the quantity. That way a retailer isn't just reacting to a threshold but ordering the right amount when it does.
Best Practices for Setting Reorder Points
Best Practice 1: Calculate per SKU, per location
A network-wide reorder point average hides more than it reveals. The same SKU can need a very different reorder point in a high-traffic urban store versus a smaller rural location. Daily demand and delivery frequency simply differ between the two.
Best Practice 2: Build your promotion calendar into the buffer
If planned promotions aren't fed into the reorder point calculation ahead of time, the system will always be reacting a step too late. Feeding promotion volume forecasts in as a temporary uplift to demand keeps stock ahead of the spike instead of behind it.
Best Practice 3: Treat perishables as a separate case
For fresh and short-shelf-life categories, a reorder point calculated the same way as ambient goods causes problems either way. It will either strand product past its sell-by date or leave gaps on the shelf. Safety stock for perishables needs to weigh shelf life against demand variability, not just the standard formula.
Best Practice 4: Track supplier reliability, not just contracted lead time
A supplier's stated lead time and its actual, on-the-ground lead time are often two different numbers. Feeding real delivery performance back into the reorder point calculation, rather than the number on the contract, catches drift before it causes a stockout.
Best Practice 5: Review exceptions, not every SKU
Once reorder points are calculated correctly for the bulk of an assortment, the useful work shifts to exception management. That means flagging the handful of SKUs where actual sales are drifting away from forecast. A planner's time then goes toward products that need a human look, not toward re-checking numbers that already work.
How to Automate Reorder Point Calculations
Recalculating reorder points by hand across a few thousand SKUs and dozens of stores isn't just tedious. It's slow enough that the numbers are stale before anyone finishes the spreadsheet. According to Gartner, 70% of large-scale organizations are expected to adopt AI-based demand forecasting by 2030. The draw is touchless forecasting, which removes the lag between a demand shift and a system catching up to it.
This is where dedicated replenishment software earns its keep. Instead of a single static formula, an AI-driven platform recalculates reorder points continuously per SKU per store. It factors in POS-level demand signals and live supplier lead times. It also weighs promotion calendars and shelf-life constraints for fresh inventory instead of relying on a formula that was accurate the day someone last updated it.
Georgia-based supermarket chain Daily is a practical example. Before automating replenishment, store managers manually overrode auto-generated orders, promotions were planned in Excel outside the ordering system, and inventory indicators had to be calculated by hand. After implementing LEAFIO Inventory Optimization, sales increased by 23% and inventory turnover improved by 16% (from 30 days down to 24), while average on-shelf availability rose by 8%.
A similar pattern shows up outside the grocery. OMA, an Eastern European DIY and building materials retailer, ran on a manual min-max system with a 60-day stock buffer. Its assortment spanned roughly 70,000 SKUs and more than 1,000 suppliers. After implementing LEAFIO Inventory Optimization, sales rose by 32% and inventory turnover improved by 18% (about 6 days faster) within two years of go-live.
Automating the calculation doesn't remove the need to understand the formula behind it. It just means the formula gets recalculated at the pace retail actually moves.
Limitations of Reorder Points
The reorder point formula assumes lead time and demand are reasonably well understood. It breaks down for brand-new products with no sales history, for categories facing sudden shocks (a viral trend, a supplier outage), and for highly seasonal items. A single trailing average badly misrepresents demand at different points in the year for that last group. In those cases, a reorder point still gives a starting point. It needs to be paired with demand sensing or manual planner judgment rather than left to run untouched.
It's also worth remembering that a reorder point only controls when to reorder, not the underlying causes of poor availability. If supplier reliability is genuinely unpredictable, or if store-level data feeding the calculation is inaccurate, no formula will fully compensate. The reorder point is a tool for managing known variability, not a substitute for fixing broken data or broken supplier relationships.
FAQ
What is the reorder point, exactly?
The reorder point is the stock level at which a business should place a new order to avoid running out before the replacement stock arrives. It combines expected demand during the supplier's lead time with a safety stock buffer.
How to determine the reorder point for a new product with no sales history?
Use a comparable SKU's demand pattern as a starting proxy. Then set a more generous safety stock until enough real sales data accumulates to calculate reorder point levels with confidence.
How often should I recalculate reorder points?
Monthly at minimum for stable categories, and more frequently, ideally continuously through software, for fast-moving or promotion-heavy categories where demand shifts quickly.
Can I calculate a reorder point without safety stock?
Yes, but only where lead time and demand are both extremely stable and a stockout carries low consequence. For most retail categories, skipping safety stock is a false economy.
What's the difference between reorder point and minimum stock level?
They're often used loosely as synonyms, but a true reorder point accounts for lead time explicitly. A "minimum stock level" set by a manager is sometimes just a round number without that calculation behind it.
Does the reorder point formula change for perishable goods?
The formula stays the same, but safety stock needs to be capped by shelf life. Carrying more safety stock than a product's shelf life allows just shifts the risk from stockout to write-off.
Is a higher reorder point always safer?
No. A higher reorder point protects availability but raises carrying costs, storage pressure, and, for short-shelf-life goods, shrink. The goal is an optimal point, not the highest possible one.
How does reorder point planning change across multiple store locations?
Each location needs its own reorder point, since local demand, delivery schedules, and even shelf space can differ meaningfully between two stores in the same chain.


Have a question?

Jack Larson
Retail Optimization Expert