

A category manager sets the monthly forecast on the first of the month. Twelve days later, a competitor launches a surprise promotion. By day twenty, the shelf is either empty or buried in markdowns nobody planned for. The forecast wasn't wrong on average. It was wrong at the exact moment that mattered.
That's the real question behind weekly vs. monthly forecasting. It's not which cadence is more accurate in the abstract. It's the one that catches problems while there's still time to act. Get the cadence wrong for a category, and you pay for it twice. Once in lost sales when demand outruns your review cycle, and again in overstock when it doesn't move at all.
What Inventory Forecasting Cadence Actually Controls
Inventory forecasting cadence is how often you regenerate and review demand forecasts as part of your broader inventory planning, whether monthly, weekly, or somewhere in between. It sounds like a scheduling detail. In practice, it sets the ceiling on how fast your replenishment, safety stock, and purchasing decisions can respond to what's actually happening on the shelf.
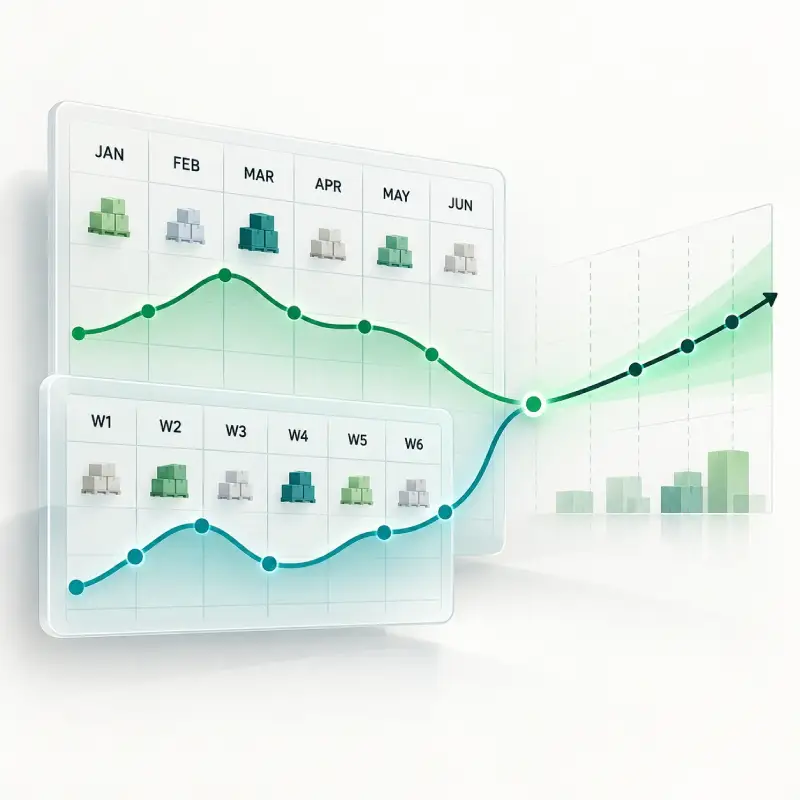
Monthly demand forecasting bundles 30 days of sales into one number, smoothing out day-to-day noise. Weekly demand forecasting keeps that data in 52 slices a year, closer to the pace stores actually run at. Neither is inherently better. Cadence should follow lead time, demand volatility, and category behavior, not habit or whichever spreadsheet a planner inherited. Retailers chasing the "right" forecasting frequency retail-wide usually end up disappointed, because the right answer changes by category.
For most chains, the honest answer to weekly or monthly forecasting isn't "pick one." It's "know which SKUs need which." That single distinction is where most generic advice on this topic falls short.
Monthly vs. Weekly Forecasting: What's the Real Difference?
Monthly forecasting buckets demand into calendar months. It generates one number per SKU per location and gets reviewed on a fixed monthly cycle. It's built for planning against long-term trends and seasonality, and it tolerates messy day-level data because the monthly total absorbs the noise.
Weekly forecasting does the same thing at a finer resolution: 52 forecast periods instead of 12, updated and reviewed every week. It catches short-term shifts faster, at the cost of reacting to swings that might just be noise rather than a real change in demand.
Most monthly vs. weekly inventory forecasting comparisons miss something important: cadence and review frequency aren't the same thing. A retailer can generate a forecast weekly but only act on major deviations monthly. Or it can run monthly numbers with a lightweight weekly exception check layered on top. Cadence is how often the number gets recalculated. Governance is how often someone actually looks at it and decides whether to step in.
Monthly Forecasting: When It Works and When It Doesn't
Monthly cadence isn't a fallback for retailers who haven't gotten around to weekly review. For a specific set of categories, it's genuinely the better choice.
Where Monthly Forecasting Holds Up
Monthly forecasting retail programs work well for categories with long lead times, stable demand, and enough sales volume that daily order-timing quirks wash out. If a supplier's lead time runs 6 to 10 weeks, a forecast refreshed every seven days won't change this week's order anyway. There's no operational payoff to the extra review cycles. Staple grocery, basic apparel, and core hardware SKUs usually fit this pattern. Demand is fairly flat, promotions are infrequent, and the coefficient of variation on weekly sales is low enough that monthly totals stay representative.
Monthly cadence also suits lean teams. If one planner covers a wide assortment alongside other responsibilities, a monthly review is sustainable in a way that 52 separate weekly cycles aren't. For stable categories, the accuracy trade-off is usually small.
Where Monthly Forecasting Breaks Down
The same smoothing that makes monthly forecasting stable also makes it slow to notice trouble. A promotion that spikes demand in week two won't show up meaningfully until the next monthly cycle. By then the stockout has already happened, and the extra stock ordered to compensate arrives just as demand normalizes. Fresh and short-shelf-life categories are especially exposed here. Waiting a full month to correct a forecast on something that spoils in days isn't a minor lag. It's a guaranteed write-off.
Retailers with short lead times also give something up by defaulting to monthly. If you can restock in a week but only reforecast every 30 days, you're carrying safety stock to cover a review gap you don't actually need. That quietly inflates working capital tied up in inventory and drags down inventory turns you could otherwise put toward cash flow.
Weekly Forecasting: When It Works and When It Doesn't
Weekly cadence flips the trade-off. It costs more planner time, but it buys speed, and for the right categories, that trade is worth making.
Where Weekly Forecasting Pays Off
Weekly forecasting retail programs earn their keep on volatile, promotion-heavy, or short-lead-time categories. A monthly cycle here means planners are always reacting to last month's demand instead of this week's. Fresh food, seasonal apparel drops, and anything running frequent promotions benefit from a cadence that can pick up a trend within days rather than weeks. If your ordering cadence is already weekly, generating forecasts on the same rhythm keeps planning and execution in sync instead of working from stale numbers.
Weekly cadence also surfaces exceptions earlier. A demand spike or a supplier delay shows up in the next weekly cycle, not buried inside a monthly average alongside three unremarkable weeks.
Why Weekly Forecasting Can Create More Problems Than It Solves
Here's the part most vendor blogs skip. Weekly forecasting isn't just monthly forecasting done more often and therefore automatically better. More frequent data points mean more zero-sale days in the mix. They mean more noise from one-off promotions or stockouts bleeding into the baseline. And they mean more chances for a planner to overreact to a blip that would have washed out over a full month. For long-lead-time products, weekly updates are mostly theater: a number that changes every seven days doesn't change what you can order for a shipment that's eight weeks out.
Weekly cycles are also heavier on the team. Fifty-two review cycles a year instead of twelve means more time spent on operational forecasting tasks: regenerating and sanity-checking numbers. That's a real cost for a lean planning team, not just a preference. Weekly seasonality is genuinely harder to model than monthly seasonality too. A holiday or promotional peak can shift by a week year over year and throw off a naive comparison.
Monthly vs. Weekly Forecasting: Side-by-Side Comparison
| Factor | Monthly Forecasting | Weekly Forecasting |
|---|---|---|
| Best fit | Stable demand, long lead times, low-volatility SKUs | Volatile demand, short lead times, promo-driven SKUs |
| Forecast accuracy for stable products | Generally higher, absorbs order-timing noise | Can be lower unless volume per SKU is high |
| Speed to catch demand shifts | Slow, up to a full month's lag | Fast, within days |
| Planning effort | Lower, 12 cycles a year | Higher, 52 cycles a year |
| Seasonality handling | More reliable, less sensitive to calendar shift | Trickier, holidays and promos can move by a week |
| Risk if mismatched | Stockouts and write-offs on fast-moving or fresh SKUs | Overreaction to noise, wasted planner time |
How to Choose the Right Forecasting Cadence for Your Business
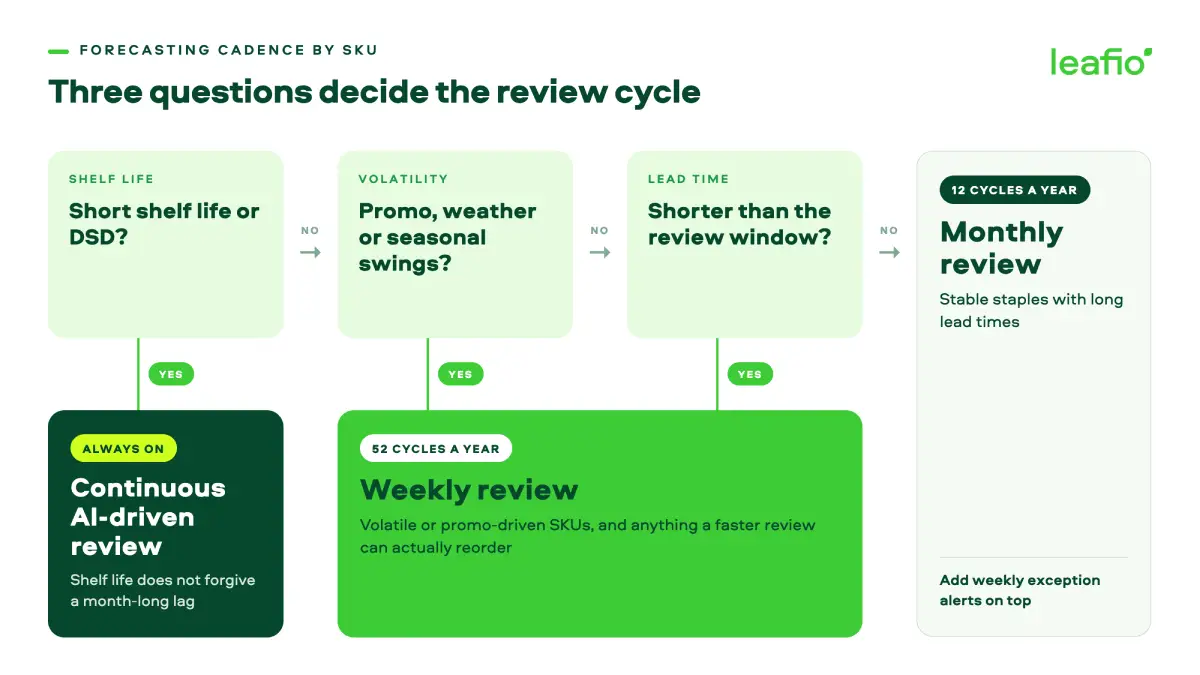
Three factors decide cadence for a given category: lead time, demand volatility, and how much review capacity your team actually has.
Match Cadence to Lead Time
Start here. Lead time is the constraint that actually limits what a shorter cycle can accomplish. If a category's supplier lead time is longer than your review window, weekly forecasting can't change near-term orders and mostly adds overhead. If lead time is a week or two, monthly cadence leaves real accuracy on the table. You could be reacting to this week's demand instead of last month's average.
Match Cadence to Demand Volatility
Products with high week-to-week variation, whether it's driven by promotions, weather, or seasonality, benefit from a tighter review cycle. That cycle catches the demand variation before it becomes a stockout or a pile of excess stock. Products with flat, predictable demand don't need the extra cycles. Forcing them through weekly short-term planning wastes attention better spent on strategic planning for the categories that actually need it. This is where a hybrid forecasting approach earns its place. Most retailers aren't choosing one cadence for the whole assortment. They're segmenting SKUs by volatility and lead time, then assigning cadence accordingly.
Match Cadence to Category and Team Capacity
Fresh and DSD categories generally need something closer to weekly review regardless of volume, because shelf life doesn't forgive a month-long lag. Long-shelf-life staples can usually run on a monthly rhythm with weekly exception alerts layered on top, rather than full weekly reforecasting. Team capacity is a real constraint too, not an excuse. A planner covering thousands of SKUs can't run genuine weekly reviews on everything. The alternative is burning out or rubber-stamping the system's output, and rubber-stamping defeats the purpose of the review.
How AI-Powered Forecasting Ends the Monthly vs. Weekly Dilemma
Most of the friction in the weekly and monthly forecasting debate comes from treating it as one company-wide supply chain planning setting instead of a per-SKU decision. Manually managing that segmentation at scale is exactly the kind of work spreadsheets handle badly. This is where AI-powered demand planning changes the math. Instead of forcing every category onto one cadence, an AI forecasting engine continuously recalculates demand as new sales data comes in. It does this while accounting for the different demand patterns, lead times, and replenishment requirements of individual SKUs. On the execution side, replenishment software turns those updated forecasts into ordering decisions without waiting for the next scheduled review.
That shift matters more than it sounds. In LEAFIO Inventory Optimization, continuously updated SKU-location forecasts feed directly into replenishment calculations. Ordering decisions can then respond to changes in demand without waiting for a planner's next weekly or monthly review cycle.
Seventy percent of large-scale organizations are expected to adopt AI-based forecasting to predict future demand by 2030, according to Gartner. The driver isn't novelty. Touchless, continuously updated forecasting removes the false choice between reacting fast and reacting accurately. A 2024 McKinsey survey of 88 supply executives found that 74% of leaders have implemented, or plan to implement, AI in demand planning, per Supply Chain Dive. That suggests segmentation-by-default is becoming the norm rather than the exception.
The stakes aren't abstract. Out-of-stock issues alone cost the U.S. retail industry an estimated $48 billion over a recent 52-week period, according to NielsenIQ. A meaningful share of that traces back to forecasts that were technically correct on average. They were just too slow, or too coarse, to catch the specific week a category needed attention.
KOLO, a European grocery chain, saw this play out directly. Running on a legacy auto-order system with limited handling for seasonality and fresh categories, the chain switched to LEAFIO Inventory Optimization. The chain compared its first full quarter on the new system against the prior quarter. Overstock dropped 43%, sales rose 20%, inventory turnover improved 17%, lost sales fell 13%, and product availability climbed 14%. Those results came from moving away from rigid calendar-based forecasting toward continuously updated, SKU-level demand forecasts that feed directly into automated replenishment decisions.
MINII Delgur, a discount supermarket chain in Mongolia, shows a different failure mode. Long-shelf-life goods ran on manually set MIN/MAX thresholds that category managers rarely revisited, while fresh and DSD orders were placed by phone with no forecast behind them at all. A threshold nobody updates is just a slower kind of rigid cadence—the review happens the moment stock crosses a line someone set months ago, not the moment demand actually shifts. LEAFIO replaced both with continuously recalculated parameters tied to live demand. Within the first year, MINII grew sales by 34%, cut average overstock by 18%, and reduced total inventory days by 30%
Neither chain solved this by choosing weekly or monthly forecasting as a company-wide policy. They moved beyond fixed review cycles toward continuously updated forecasting and automated replenishment.
If your assortment is stuck on one rigid cycle today, request a LEAFIO demo to see how this works across different SKU and category profiles.
FAQ
A few questions come up in almost every conversation about forecasting cadence. Here are direct answers to the most common ones.
Is monthly or weekly forecasting more accurate?
Neither is universally more accurate. Monthly forecasting tends to be more accurate for stable, high-volume products, because it smooths out order-timing noise and short-term fluctuations. Weekly forecasting is more accurate for volatile or promotion-driven products, where a monthly average would hide the swings that actually matter for replenishment.
When should I use weekly forecasting instead of monthly?
Use weekly forecasting when lead times are short enough that a faster review can change what you order. Use it too when demand is volatile due to promotions or seasonality, or when a category has a short shelf life that can't tolerate a month-long correction lag. Fresh food and heavily promoted SKUs are the clearest cases.
What is the best forecasting cadence for retail inventory?
There usually isn't one best cadence for an entire assortment. The best approach segments SKUs by lead time, volatility, and shelf life. It assigns monthly review to stable, long-lead-time categories, and weekly or continuous review to volatile, short-lead-time, or perishable ones.
How does lead time affect forecasting frequency?
Lead time sets a practical floor on how often reforecasting actually helps. If a supplier's lead time is longer than your review cycle, a more frequent forecast can't change near-term orders and mostly adds planning overhead. Short lead times are what make weekly or continuous forecasting worth the extra effort.
What are the drawbacks of weekly inventory forecasting?
Weekly forecasting increases planning workload roughly fourfold compared with monthly cycles. It introduces more noise from single-day anomalies and stockout periods. It also makes seasonality harder to model, since holiday or promotional peaks can shift by a week from year to year. For long-lead-time products, it adds effort without a matching improvement in ordering decisions.
Should I forecast weekly or monthly for my business?
It depends on your assortment mix more than your business size. A retailer with mostly stable, long-lead-time staples can run monthly cycles with weekly exception monitoring. A retailer with a large volatile or fresh assortment needs weekly or continuous forecasting there, even if the rest of the business stays on a monthly rhythm.


Have a question?

Andrew Ivarsen
Logistics Optimization Expert