

Retail analytics provides the data you need to make informed management decisions about the most critical aspects of retail business. From understanding customer behavior and demand to optimizing inventory, the information gained through data analytics helps to drive strategic decision-making and bring sales to a new level.According to the McKinsey study "Big Data, Analytics, and the Future of Marketing & Sales,” businesses utilizing advanced analytics have observed a 15–20% improvement in marketing ROI. Experts forecast that the retail data analytics market size will grow at a CAGR of 4.23% during 2024-2029.
This article will explore the fundamental advantages and types of retail analytics, best practices, and specialized data-modernization solutions for retailers aiming to thrive in today's marketplace.
Key Takeaways
Retail analytics turns data into actions that grow sales & cut costs.
Tracks KPIs like GMROI & turnover.
Highlights assortment gaps.
Improves promo effectiveness.
Uses dashboards for fast insights.
Drives store-specific decisions.
Retail analytics explained
Let’s dig a little deeper into what analytics for retail is and why it's so important for retail businesses, shall we?
What is retail analytics?
Retail analytics is a process of collecting and studying data to identify trends, predict results, identify weaknesses, make better business decisions, and increase profits. Almost all retailers run some kind of analytics, even if it's just sales information in Excel. However, a completely different effect is observed when using specially created software based on artificial intelligence to simultaneously analyze big data from different sources. In fact, 80% of retail executives expect their businesses will use intelligent automation solutions by 2025, according to Analytics Insight.
Why is retail analytics so important?
Analytics makes dealing with many typical problems a piece of cake. Analytics enables data-driven decision-making when identifying customer patterns, forecasting demand, optimizing store layouts, reducing operating costs, etc. For example, products often bought together can be placed on the shelves together, or personalized discounts are made available to regular customers, increasing the average basket size and more frequent visits.
Key advantages of retail analytics
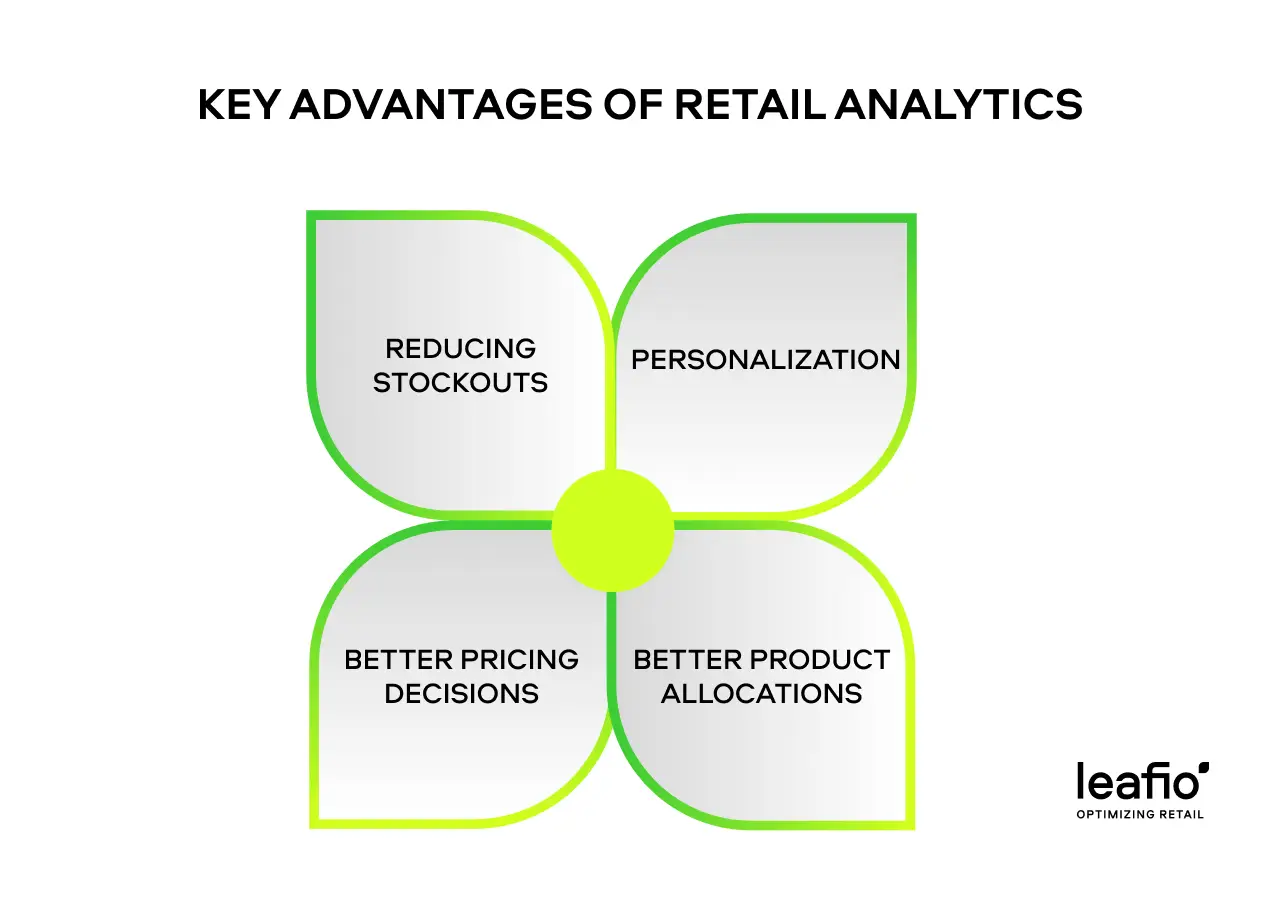
When it comes to the main benefits of using retail business analytics, we should note the following:
Reducing stockouts
Data analytics helps in the inventory management sector. Through data, retailers can identify demand trends to keep product availability at an optimal level, preventing the appearance of overstocks or, conversely, empty shelves.
Personalization
Analytics helps retailers understand customer behavior and preferences to provide better offers than competitors. For example, Starbucks provides customers with personalized offers by analyzing customer data through its loyalty program and mobile app. This analytics has significantly increased customer engagement and sales per visit.
Better pricing decisions
Retail analytics helps to optimize pricing based on the collected information, taking into account various factors, such as abandoned shopping carts, competitors' prices, and the cost of goods sold. This way, retailers can maximize profits by avoiding setting prices either too high or too low.
Better product allocations
Analytics can also help retailers decide how to distribute products to different regions, distribution centers, and stores. Many retailers have already customized space allocation to local customer demand, but not everyone has yet achieved automated store-specific SKU selection and planograms. For example, the Polish convenience store chain Zabka can choose the proper SKU selection for the nearest location for each address in the country and identify how much sales and margin it will drive – this has allowed the chain to show strong growth in recent years.
Basic types of retail analytics
There are four types of retail analytics: descriptive analytics, diagnostic analytics, predictive analytics, and prescriptive analytics. Let's examine each one.
#1 Descriptive analytics
Descriptive reports answer questions like “How many, when, where, and what?” – the most fundamental and common questions. Reports on sales, inventory levels, and other basic metrics are generated based on raw retail data from various sources, such as POS terminals, inventory systems, ERP systems, etc. Before, this data was collected manually in Excel, but today, this process is greatly simplified thanks to retail analytics solutions.
#2 Diagnostic analytics
Diagnostic analytics helps identify performance issues by studying customer feedback, financial indicators, and operational metrics. These reports answer the "why" question to solve specific business problems. Analytical solutions use algorithms and machine learning to drill down into the collected retail data insights, find correlations between data points, and identify potential issues or anomalies.
#3 Predictive analytics
Retail predictive analytics answer the additional “what’s next” question. This analytics is used to predict future trends using data from descriptive and diagnostic analytics. Retail predictive analytics decodes correlations between product demand, market prices, and inventory to make informed management decisions.
#4 Prescriptive analytics
Prescriptive analytics is the most powerful type of analytics. It tells you "what" is happening, "why" it has happened, and "what will happen next" by combining artificial intelligence and big data to turn analytics results into valuable recommendations.
To perform well and provide sound recommendations, a prescriptive analytics system must not only predict but also know what actions will lead to the best possible outcome in the future.
Ways to use retail data analytics
Companies use analytics in a variety of cases. Regardless of the area of use, its main task is to help retailers increase sales and customer satisfaction.
Inventory analytics
Inventory retail analytics evaluates inventory levels and optimizes warehousing and distribution strategies. It helps track key performance indicators in inventory and detect all problem areas. For example, retail analytics software will spot if there is an imbalance between a surplus in one store and a lack of stock of the same product in others.
The Daily supermarket chain has increased sales by 23% through centralized inventory management and using the LEAFIO AI analytics module. Before, Daily had to calculate inventory indicators manually, leading to delayed identification of issues such as product shortages or lost sales. However, after implementing the LEAFIO Inventory Optimization and BI Module, the chain's inventory turnover rate improved by 16% from 30 to 24 days, and average availability increased by 8%.
Merchandise analytics
Merchandise analytics drives retailers to make data-driven layout changes and assortment rotation decisions. For instance, by using merchandise analytics, you might discover that featuring seasonal items close to the store entrance led to a 20% increase in sales.
With the LEAFIO AI Retail Platform, you can create planograms based on analytical data on sales and ABC analysis while sorting them by category, brand, supplier, etc. It also generates 8 reports for you to easily review the effectiveness of your merchandising solutions.
Supply chain control tower
A supply chain control tower offers real-time visibility and control over a retailer's entire supply chain, enabling proactive decision-making. By integrating data from inventory systems, suppliers, and external factors, the supply chain control tower helps manage inventory levels, predict demand, and respond swiftly to changes.
For example, it can highlight inventory imbalances across stores and distribution centers, recommending adjustments to prevent stockouts or excess inventory. This ensures that demand forecasting and promotional planning are optimized, allowing for timely product availability without unnecessary stock build-up.
Retailers using supply chain control towers benefit from improved inventory turnover rates, reduced stock waste, and greater alignment with supplier operations. As a result, they achieve more efficient, data-driven retail operations, helping to maintain customer satisfaction and reduce costs.
Business intelligence (BI) reports
Retail business intelligence (BI) reports check the "health" of your business by showing specific key performance indicators. Business Intelligence tools help retailers structure and visualize data, such as inventory turns and the sell-through rate. For example, the LEAFIO AI Retail BI Software uses essential retail indicators to generate 40+ reports of in-depth analytics, including lost sales reasons, suppliers, and proms.
Demand forecasting
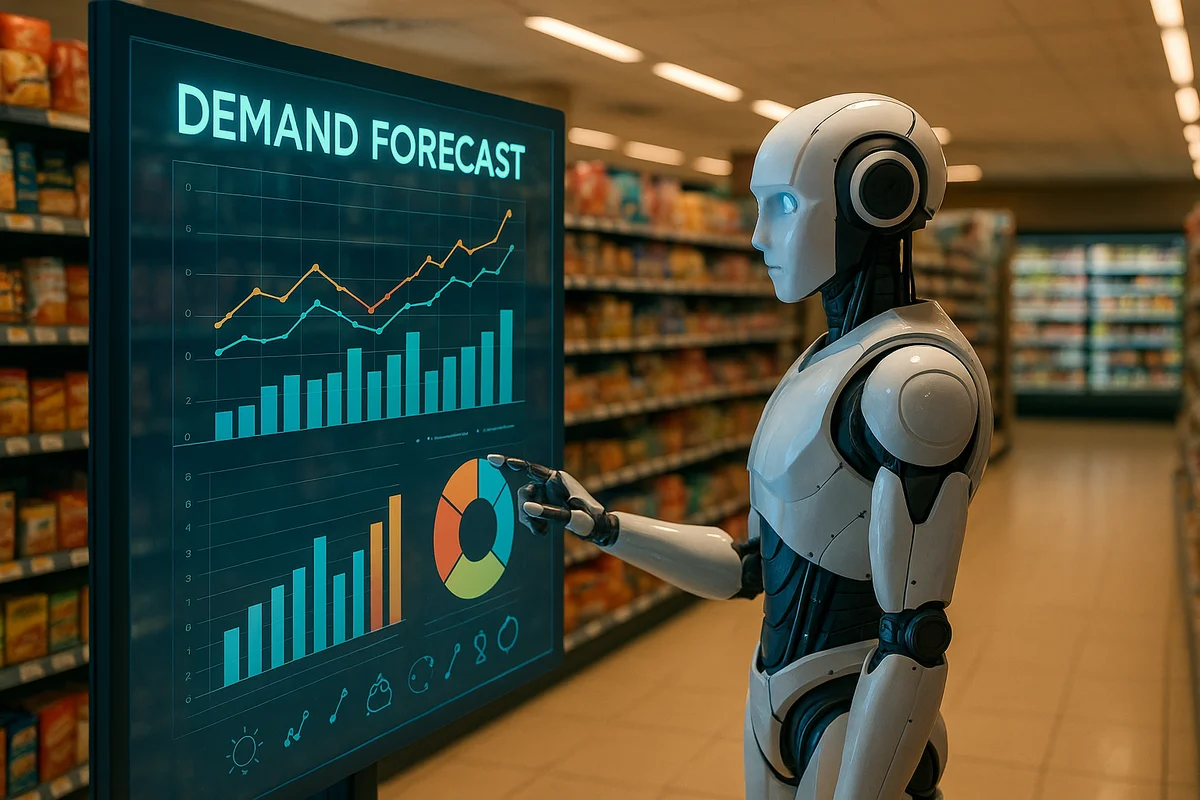
Strong demand forecasts give you a better idea of what you'll need. Machine learning analytics models predict future customer demand based on historical sales data and consumer behavior. Demand forecasting based on big data enables retailers to optimize costs, use resources efficiently, and systematically improve customer satisfaction.
To paint a clearer picture, LEAFIO's AI-powered demand planning software allows you to calculate the future demand for each product. The system considers internal factors (traffic, current sales, promotions) and external factors (weather, region, season, etc.) to create the most accurate forecast and avoid lost sales.
Sales forecasting
Analyze historical sales data to identify trends and use it to forecast future sales. Sales analytics manages inventory purchasing, budget management, setting financial goals for the business, and more. Retailers use predictive analytics to forecast sales for the next day, quarter, or year. Understanding which products will sell better allows optimizing logistics and improving retail operations at all stages, increasing sales by an average of 10%.
Top 5 retail analytics best practices

Here are a few tips to help you collect and process retail data insight correctly and fully utilize its potential.
#1 Collect the correct data
Not all information was created equally helpful. Choosing the correct data is essential to avoid "noise" in your analytics and distortion of results. Several standard data sets are commonly used for analysis and reporting in retail:
| Inventory management data | Inventory costs Stock levels Overstocks Inventory turnover |
|---|---|
| Merchandising data | Sales per foot Profits per foot Profit share ratio Number of facings |
| Market data | Competitor pricing Competitor market share and customer profile Competitor product lines Market share |
| Sales data | Gross margins and revenue Turns Gross margin return on inventory investment Data by retail outlets |
| Supply chain data | Demand for products based on season, region, demographic, etc Determine profitable products Track items sold (in total or by category) Suppliers' delivery schedules and holidays Lead time Suppliers' reliability rate |
| Promotional data | Discount percentage Type and duration of promo campaign List of promotional SKUs Price before and during the campaign Mechanics of the campaign Location Availability of additional layouts or displays Category hierarchy Sales before and during the promotion |
| Customer data | Demographics Frequency Loyalty Customer feedback |
#2 Use data visualization tools
Charts, graphs, and dashboards are visualization tools that make data more accessible and easy to understand and help you identify key business insights. After all, when a retailer sees massive columns with many numbers, it's hard to make an informed decision quickly. If specialized data analytics software can immediately visualize the results of retail analytics, it improves business processes significantly.
For example, the LEAFIO AI Platform has a LEAFIO Shelf Efficiency solution with visual analytics that helps you to see hot and cold zones on the sales floor according to ABC sales, profit, cost price, etc.
#3 Analyze multiple data sources
Analyze data from different internal and external sources to gain detailed, valuable insights into your business. For example, correlate in-store analytics with merchandise attribute analytics and inventory analytics. Using a unified platform, such as LEAFIO AI, will help you avoid discrepancies, as it collects and analyzes data from multiple sources at once.
#4 Track KPIs regularly
Key KPIs should be measured regularly to keep an eye on your business and identify areas for improvement. Use weekly summaries of key performance indicators including reviewing recent metrics and identifying trends to understand, for example, what's behind sales changes or availability drops.
#5 Prioritize your goals
It's easy to lose sight of the bigger picture when you're flooded with data. It's important to prioritize and measure what really needs to be measured to achieve specific business goals such as:
- increasing the basket size;
- sales in new retail outlets;
- boosting customer loyalty;
- optimizing pricing strategies;
- improving sales staff performance.
LEAFIO AI in-depth retail BI analytics
The LEAFIO Retail Business Intelligence Software solution is a powerful driver of inventory management productivity. As a top-of-the-line retail analytics software, it helps you to pinpoint what your money is invested in store operations and estimate when it will return as a profit. It provides retailers with a simple, intuitive interface that makes it easy to see problem areas and helps identify the root causes of the problems.
The LEAFIO Retail BI Analytics is a highly advanced diagnostic tool that leverages key retail metrics with over 40 comprehensive reports and essential retail indicators, including:
- The LFL report helps to see dynamics and trends compared to previous periods (years, months, weeks). It will give you data on key metrics: inventory, sales, surplus, lost sales, turnover, etc.
- Analysis by SKU is a report that complements the LFL analysis with more detailed data on each SKU and its storage location at all levels of the supply chain to evaluate the situation of all items quickly and their balance in all retail stores.
- Lost sales reasons is a report that makes it possible to determine the cause of losses at all levels (product, category, manager, or supplier).
- Suppliers report allows a retailer to check the quality of cooperation with a specific supplier with the most important information: what was ordered; what was done or not, what terms, what supplier’s share in purchases and sales, etc.
- Promo report provides full information on completed promotions by type and period. The report allows you to evaluate the effectiveness of promotional activities in terms of sales, SKU availability during the promo, post-promotion balances, etc.
- ABC(D) & XYZ report provides an in-depth analysis of product management. ABC(D) analysis monitors changes in the sales dynamics of an SKU by categorizing it into the relevant product category. Meanwhile, XYZ also groups products according to sales variability.
Future of retail analytics
In the coming years, retailers will use all the power of advanced analytics to gain a competitive advantage and increase their success.
Analytics in retail sector is becoming more widespread and accessible to business users. Moreover, it will no longer be limited to viewing weekly reports filled with huge columns of numbers and will become more visualized, user-friendly, and integrated into daily business operations. An advanced supply chain control tower will become essential in this evolution, allowing businesses to integrate predictive analytics with real-time supply management.
No one can predict what the next global crisis will be, but analytics can help you to make data-driven decisions faster and respond to the changing economic environment.
FAQ
What is retail analytics?
Retail analytics is the process of collecting and studying data to identify customer trends, forecast results, identify weaknesses and strengths, and improve decision-making to boost sales.
What kind of data is used in retail analytics?
Retail analytics uses a variety of data from different sources. For example, customer purchase histories, demographics, competitor pricing, inventory data, and so on.
What retail analytics tools are commonly used?
Today, many retailers are turning to specialized data-modernization solutions to ensure full data visibility, generate more powerful and accurate analytics, and drive better data-driven decisions. The LEAFIO Retail BI Software is one of the most highly advanced retail analytics tools, checking the "health" of inventory management by using fundamental retail indicators with 40+ reports of in-depth analytics.
What are two ways that data analytics benefits retailers?
Two primary advantages of data analytics for retail include customer-centric strategies and operational excellence through optimizing internal processes, ensuring smooth operations and resource utilization.
Which kinds of decisions does retail analytics help retailers make?
Retail analytics assists in making decisions about product assortment, inventory and merchandising management, pricing strategies, promotional planning, marketing campaigns, supplier management, sales forecasting, location planning, customer engagement strategies, and more.


Have a question?

Jack Larson
Retail Optimization Expert